Virus disrupts supply chain and mutates into inflationary strain
The liquidity fueled rebound amidst the backdrop of a persistent global infection rate saw the Pandemic mutate from being a reopening story (tourism vs tech), to disrupting the global supply chain and causing a rise in inflation (affecting consumer goods, energy, transportation & logistics). Using Affinity™ we analyze the most popular benchmark indices in the context of these industry and thematic trends.
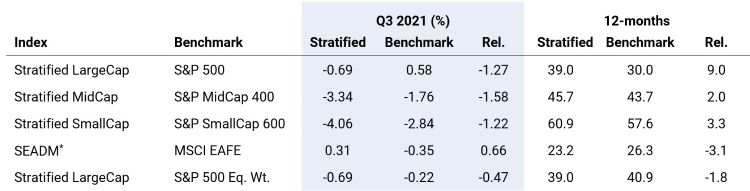
Once again, the S&P 500 benefited from having a large exposure to mega-cap software companies (GOOGL, MSFT, FB) which are insulated from the worst supply chain bottlenecks (cargo ships). The flagship S&P 500 index outperformed the Syntax Stratified LargeCap index by 1.3% in Q3 (0.6% vs. -0.7%), however, the Stratified LargeCap Index remains 9.0% above the S&P 500 for the 12 months to 30th September 2021 (39% vs 30%).
Exhibit 1. Core Index Comparison Source: Syntax, S&P Dow Jones Indices, MSCI. Total return performance does not reflect fees or implementation costs as an investor cannot directly invest in an index. 12-months covers period from 9.30.2020 to 9.30.2021. * Syntax Stratified Europe & Asia Developed Markets Index, based on the MSCI EAFE universe. Small and Midcap stocks underperformed their Large Cap counterparts in Q3 (the S&P 400 fell 1.8% and the S&P 600 fell 2.8%). Stratified Weight indices underperformed, with the Stratified MidCap and SmallCap falling 3.3% and 4.1%, respectively. The underperformance of the Stratified Smallcap index was driven by a high relative weight in the Consumer sector (14.6% in Stratified SmallCap vs 11.5% in the S&P 600) and a low relative weight in Financials (26.1% in the S&P 600 vs only 14.8% in Stratified SmallCap) which was largely unaffected by the supply chain issues.
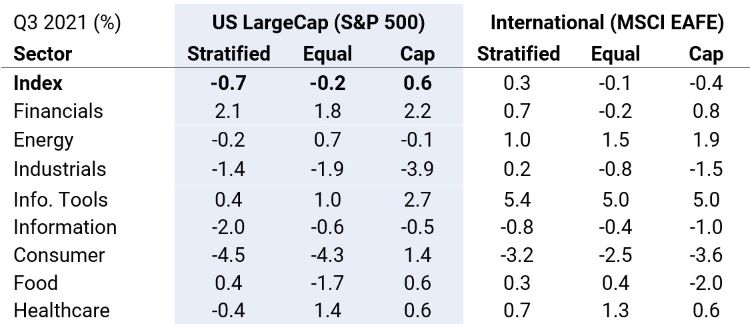
MSCI EAFE was not as exposed to the supply chain disruption as the US indices (MSCI EAFE Equal Weighted fell 0.1% and its Stratified Weight counterpart, SEADM rose 0.3%). Like the US indices, the Stratified Consumer sector was the worst of our eight broad sector groups (-3.2%). SEADM has a 12.5% weight in Consumer stocks vs 15.7% in MSCI EAFE (Exhibit 2).
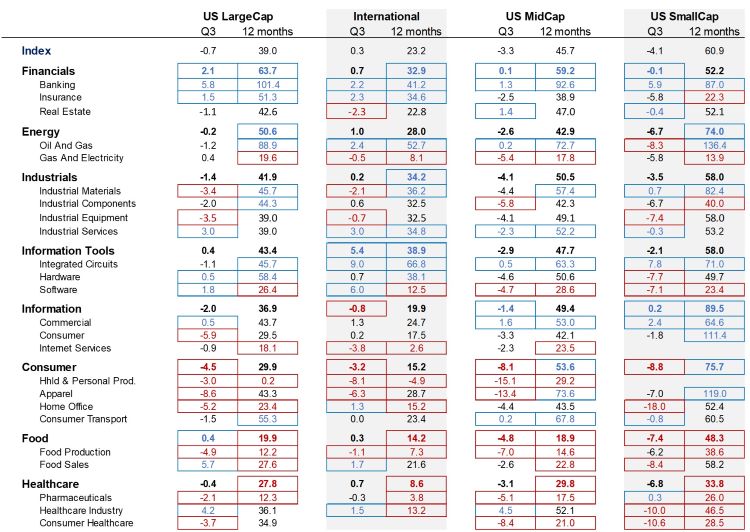
Exhibit 2. Q3 sector performance by different weighting methodologies Total return performance from 6.30.2021 – 9.30.2021. Performance does not reflect fees or implementation costs as an investor cannot directly invest in an index. Source: Syntax, S&P Dow Jones Indices, MSCI. The fallout from the Coronavirus pandemic evolved in Q3. From March 2020 through the first half of 2021, as cases rose and fell, investors switched between the more value oriented “Reopening” industries such as travel and tourism and “Stay at home” growthier groups like Software, Internet Services and IT.
In Q3 2021, the market focused on more secondary effects, such as supply chain disruption and inflation (Headline CPI rose from 1.4% at the start of the year to 5.4% by the end of Q3). These themes manifested as underperformance of the Consumer sector, (which is highly supply chain dependent) and outperformance of Financials (which is not). Large Cap consumer stocks such as Tesla (+14.1% in Q3), Home Depot (3.5%) and Lowes (5%) rose, leading to significant outperformance of the Cap Weighted Consumer Sector versus the equal and stratified weighted equivalent.
Trending and Emerging Themes
Affinity™ groups companies depending on their exposures to various themes. This quarter, we focus on the market from the perspective of different supply chains. The Affinity™ supply chain taxonomy includes companies involved with all aspects of a particular product type. For example, the consumer electronics supply chain comprises component manufacturers (Corning, Nvidia), OEMs (LG, GoPro), distributors (Arrow) and retailers (Best Buy).
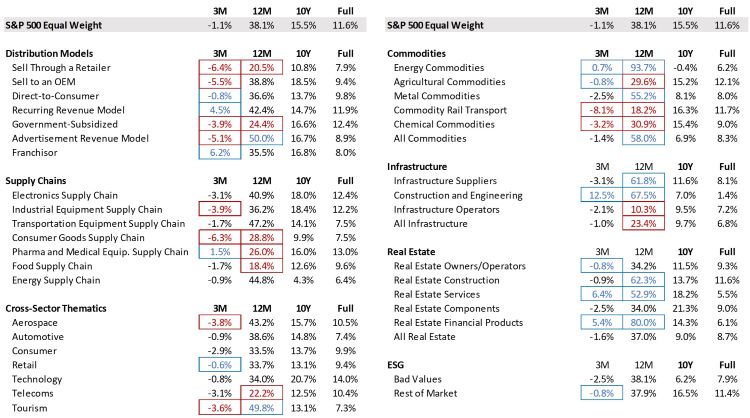
During the supply chain disruption in Q3, stocks related to the Consumer Goods Supply Chain group declined 6.3%. However, there were some areas of the consumer goods supply chain that outperformed. For example, the Home Improvement grouping which includes both lumber producers (e.g. timberland stocks like Weyerhaeuser) as well as lumber retailers (e.g. Home Depot) rose 0.9% for the quarter.
Elsewhere in the supply chain, Transport and Logistic stocks (e.g. CSX, Fedex, Prologis) fell 6.9% as bottlenecks at key ports caused container ships to anchor off-coast and wait several days for processing. Exhibit 4 shows the performance of various supply chain groups in the S&P 500.
Tourism stocks also performed poorly in Q3 (-3.6%), as the persistent infection rate hurt demand and a high oil price impacted the bottom lines of the airlines and cruise ships.
As was the case in the second quarter, one of the best performing themes in Q3 was the outperformance of stocks with recurring revenue models (including subscription services, software licenses, telecoms and REITs). This may signal investors are taking a defensive stance and placing a higher multiple on cashflow stability. The Recurring Revenues group rose 4.5% in Q3.
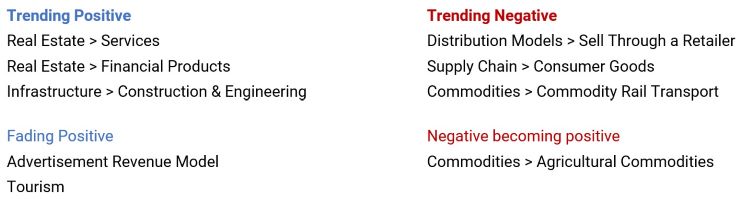
Rising real estate prices and robust demand attracted investors into related equities, seeing Real Estate Services (+6.4%) and Real Estate Financial Products (5.4%) outperform strongly, further boosting Construction and Engineering stocks (+12.5%).
Exhibit 3. Trending and Emerging Themes Source: Syntax, Affinity.
Exhibit 4. Thematic Performance and Exposure within the US LargeCap universe Source: Syntax, Affinity, S&P Dow Jones Indices. Performance is calculated as the weighted average total return of the subset of the S&P 500 Equal Weight Index constituents who are members of the Affinity Theme. QoQ shows total return for 6.30.21 to 9.30.21. YoY shows total return from 9.30.20 to 9.30.21. Full performance period uses period from 12.31.1991 when available. Performance does not reflect fees or implementation costs.
Exhibit 5. Sector performance for Stratified US size segments and Stratified International universes Source: Syntax, Affinity™. Performance does not reflect fees or implementation costs.
Important Disclaimers
This document is for informational purposes only and is not intended to be, nor should it be construed or used as an offer to sell, or a solicitation of any offer to buy, any security. Additionally, the information herein is not intended to provide, and should not be relied upon for, legal advice or investment recommendations. You should make an independent investigation of the matters described herein, including consulting your own advisors on the matters discussed herein. In addition, certain information contained in this report has been obtained from published and non-published sources prepared by other parties, which in certain cases have not been updated through the date hereof. While such information is believed to be reliable for the purpose used in this report, such information has not been independently verified by Syntax and Syntax does not assume any responsibility for the accuracy or completeness of such information. Syntax LLC, its affiliates and their independent providers are not liable for any informational errors, incompleteness, or delays, or for any actions taken in reliance on information contained herein.
Past performance is no guarantee of future results. The inception date of the Syntax Stratified LargeCap and Syntax Stratified MidCap Indices was December 27, 2016. The inception date of the Syntax Stratified SmallCap Index was January 3, 2020. The inception date of the Syntax Europe & Asia Developed Markets (“SEADM”) Index was January 1, 2016. The inception date of the Syntax Real Asset Index was July 1, 2015. Charts and graphs are provided for illustrative purposes only.
Index performance does not represent actual fund or portfolio performance and such performance does not reflect the actual investment experience of any investor. An investor cannot invest directly in an index. In addition, the results actual investors might have achieved would have differed from those shown because of differences in the timing, amounts of their investments, and fees and expenses associated with an investment in a portfolio invested in accordance with an index. None of the Syntax Indices or the benchmark indices portrayed herein charge management fees or incur brokerage expenses, and no such fees or expenses were deducted from the performance shown; provided, however that the returns of any investment portfolio invested in accordance with such indices would be net of such fees and expenses. Additionally, none of such indices lend securities, and no revenues from securities lending were added to the performance shown.
The Syntax Stratified LargeCap Index, Syntax Stratified MidCap Index, Syntax Stratified SmallCap Index, SEADM Index are the property of Syntax, LLC, which has contracted with S&P Opco, LLC (a subsidiary of S&P Dow Jones Indices LLC) to calculate and maintain the Indices. The Indices are not sponsored by S&P Dow Jones Indices or its affiliates or its third party licensors (collectively, “S&P Dow Jones Indices”). S&P Dow Jones Indices will not be liable for any errors or omissions in calculating the Index. “Calculated by S&P Dow Jones Indices” and the related stylized mark(s) are service marks of S&P Dow Jones Indices and have been licensed for use by Syntax, LLC. S&P® is a registered trademark of Standard & Poor's Financial Services LLC (“SPFS"), and Dow Jones® is a registered trademark of Dow Jones Trademark Holdings LLC (“Dow Jones”). The MSCI EAFE Index was used by Syntax, LLC as the reference universe for selection of the companies included in the SEADM Index. MSCI does not in any way sponsor, support, promote or endorse the Index. MSCI was not and is not involved in any way in the creation, calculation, maintenance or review of the Index. The MSCI EAFE Index was provided on an “as is” basis. MSCI, each of its affiliates and each other person involved in or related to compiling, computing or creating the MSCI EAFE Index (collectively, the “MSCI Parties”) expressly disclaim all warranties (including, without limitation, any warranties of originality, accuracy, completeness, timeliness, non‐infringement, merchantability and fitness for a particular purpose). Without limiting any of the foregoing, in no event shall any of the MSCI Parties have any liability for any direct, indirect, special, incidental, punitive, consequential (including, without limitation, lost profits) or any other damages in connection with the MSCI EAFE Index or the SEADM Index. Prior to March 19, 2018, the SEADM Index was calculate by NYSE. Sector subsets of the Syntax Stratified LargeCap, Syntax Stratified MidCap, and SEADM Indices are calculated using model performance generated in FactSet, and as such may differ from index calculations performed by S&P Dow Jones Indices. The Affinity Thematics are the property of Syntax, LLC, which has calculated their performance using Affinity™. Syntax will not be liable for any errors or omissions in calculating the Affinity Thematics. Syntax®, Stratified®, Stratified Indices®, Stratified-Weight™, Stratified Benchmark Indices™, Stratified Sector Indices™, Stratified Thematic Indices™, Affinity™, and Locus® are trademarks or registered trademarks of Syntax, LLC and its affiliate Locus LP.
The S&P 500® Index is an unmanaged index considered representative of the US mid- and large-cap stock market. The MSCI EAFE Index is an unmanaged index considered representative of the European, Australian, and East Asian large-cap stock market. Benchmark data for the S&P 500, S&P 500 Equal Weight, S&P MidCap 400, S&P MidCap 400 Equal Weight, S&P SmallCap 600, S&P SmallCap 600 Equal Weight, and S&P Real Assets Equity Indices are provided by S&P Dow Jones through FactSet®. Benchmark data for the MSCI EAFE index is provided by MSCI through FactSet.