The S&P 500 fell 16.10% in Q2 2022. In historical context, the market had its 9th worst quarter in post-war history, claiming its spot on the Worst 10 Quarters list by displacing the quarter containing 9/11/2001. By comparison, the Stratified LargeCap index, which holds the same stocks as the S&P 500, but with more diversified weights fell 12.98%, outperforming the cap weighted index by 3.12% and the equally weighted S&P 500 by 1.37%.
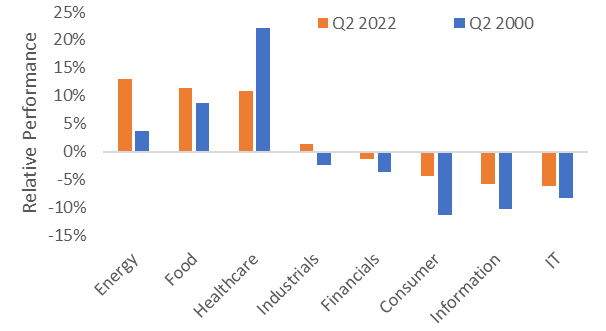
In Q2 2022, the US LargeCap Consumer, Information and IT sectors (49.2% of the S&P 500) underperformed the market by over 4%, whereas Energy, Food and Healthcare all outperformed significantly. This pattern of sector performance within the US LargeCap universe highlighted the similarities between the current market regime and that of the market environment surrounding the bursting of the DotCom Bubble in mid-2000.
Q2 2022 compared with Q2 2000 Source: Syntax, S&P Dow Jones Indices, MSCI.
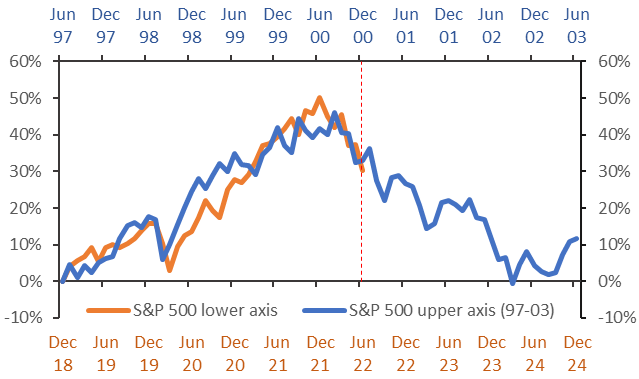
The similarities in the broad market performance have also mirrored the performance in 2000. Note that the correction in H2 2000 persisted for over two years.
DotCom market unwind compared with current sell-off Source: Syntax, S&P Dow Jones Indices.
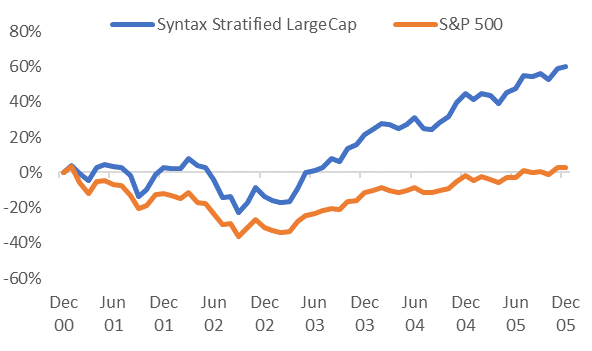
After the bubble burst, technology stocks fell out of favor with investors and their unrealistic valuations and high levels of institutional ownership persistently unwound. Cap weighted indices consistently underperformed alternatively weighted products such as the Stratified LargeCap index in the US, due to their outsized weight in the technology sectors.
Stratified LargeCap consistently outperformed from 2000-2005 Source: Syntax, S&P Dow Jones Indices
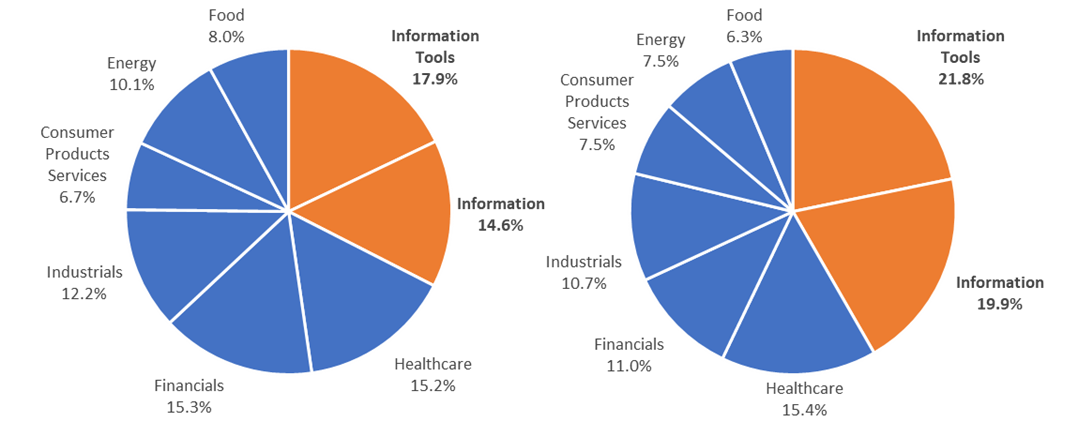
Even in light of the significant underperformance of IT and Information stocks this year, the S&P 500 is more heavily skewed towards technology than it was in December 2000, fueling concerns that the recent market environment could persist as it did back then.
S&P 500 Weights December 2000 S&P 500 Weights June 2022 Source: Syntax, S&P Dow Jones Indices
Despite 8.3% decline, markets showed signs of order in June
Even though the S&P 500 officially entered a bear market in Q2, the declines were not met with the same pandemonium that we saw during September 2001, or the early days of the Pandemic. In Q2, the market declined for more traditional reasons, namely that high inflation, rising rates and waning growth raised the probability that the US will enter a recession. Despite being disastrous for risk assets (as reflected by a 16% decline in the S&P 500 in Q2), a cyclical recession is usually easier to price than the impact of a war or a pandemic. Hence, we saw a reassuring sign in the dismal stock performance of June 2022 – a resurgence in the efficacy of the CAPM.
The CAPM is one of the most basic tenets of equity market analysis, basically stating that the expected return of an asset depends on how risky it is relative to the broad market. In other words, higher risk (beta) should lead to higher returns. However, the CAPM hasn’t had the best track record since the Pandemic took hold as the market has been driven by different risks.
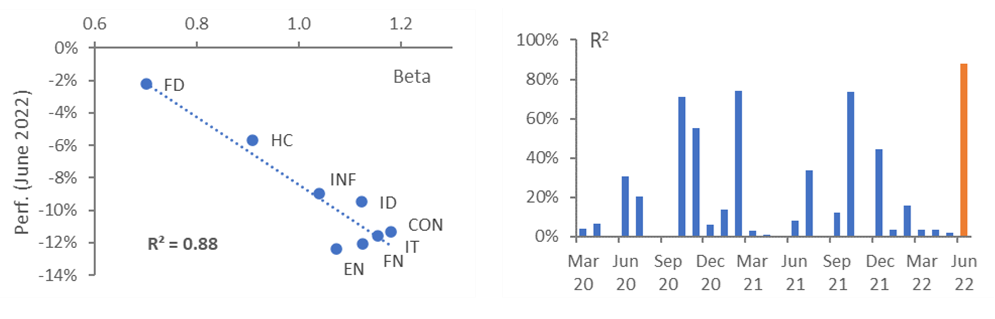
In June, beta reasserted itself as the key driver of return as shown by the correlation of sector betas with sector performance. The R-squared between sector beta and sector return was 88% in June, suggesting that sector risk explained 88% of the variance of sector returns that month. This was the highest the R-squared has been since the Pandemic began in 2020.
Relationship between sector risk and return in June and since Pandemic began Source: Syntax. The charts show the relationship between sector performance and sector beta (one month lagged). FD=Food; HC=Healthcare; INF=Information; ID=Industrials; CON=Consumer; IT=Information Technology; FN=Financials; EN=Energy.
Though this observation is likely to be little consolation to most investors, it does represent a vote of confidence to those of us who believe in the Foundations of Finance. Namely that risk drives return, earnings drive prices and diversification is the only free lunch. In a world previously driven by a herd oftentimes agnostic to value or risk (GameStop anyone?), signs that the market is reverting to a more rational regime are welcome, even when they are painful to endure.
Important Disclaimers
This document is for informational purposes only and is not intended to be, nor should it be construed or used as an offer to sell, or a solicitation of any offer to buy, any security. Additionally, the information herein is not intended to provide, and should not be relied upon for, legal advice or investment recommendations. You should make an independent investigation of the matters described herein, including consulting your own advisors on the matters discussed herein. In addition, certain information contained in this factsheet has been obtained from published and non-published sources prepared by other parties, which in certain cases have not been updated through the date hereof. While such information is believed to be reliable for the purpose used in this factsheet, such information has not been independently verified by Syntax and Syntax does not assume any responsibility for the accuracy or completeness of such information. Syntax LLC, its affiliates and their independent providers are not liable for any informational errors, incompleteness, or delays, or for any actions taken in reliance on information contained herein.
Past performance is no guarantee of future results. The inception date of the Syntax Stratified LargeCap and Syntax Stratified MidCap Indices was December 27, 2016. The inception date of the Syntax Stratified SmallCap Index was January 3, 2020. The inception date of the Syntax Europe & Asia Developed Markets (“SEADM”) Index was January 1, 2016. The inception date of the Syntax Real Asset Index was July 1, 2015. Charts and graphs are provided for illustrative purposes only.
Index performance does not represent actual fund or portfolio performance and such performance does not reflect the actual investment experience of any investor. An investor cannot invest directly in an index. In addition, the results actual investors might have achieved would have differed from those shown because of differences in the timing, amounts of their investments, and fees and expenses associated with an investment in a portfolio invested in accordance with an index. None of the Syntax Indices or the benchmark indices portrayed herein charge management fees or incur brokerage expenses, and no such fees or expenses were deducted from the performance shown; provided, however that the returns of any investment portfolio invested in accordance with such indices would be net of such fees and expenses. Additionally, none of such indices lend securities, and no revenues from securities lending were added to the performance shown.
The Syntax Stratified LargeCap Index, Syntax Stratified MidCap Index, Syntax Stratified SmallCap Index, SEADM Index are the property of Syntax, LLC, which has contracted with S&P Opco, LLC (a subsidiary of S&P Dow Jones Indices LLC) to calculate and maintain the Indices. The Indices are not sponsored by S&P Dow Jones Indices or its affiliates or its third party licensors (collectively, “S&P Dow Jones Indices”). S&P Dow Jones Indices will not be liable for any errors or omissions in calculating the Index. “Calculated by S&P Dow Jones Indices” and the related stylized mark(s) are service marks of S&P Dow Jones Indices and have been licensed for use by Syntax, LLC. S&P® is a registered trademark of Standard & Poor's Financial Services LLC (“SPFS"), and Dow Jones® is a registered trademark of Dow Jones Trademark Holdings LLC (“Dow Jones”). The MSCI EAFE Index was used by Syntax, LLC as the reference universe for selection of the companies included in the SEADM Index. MSCI does not in any way sponsor, support, promote or endorse the Index. MSCI was not and is not involved in any way in the creation, calculation, maintenance or review of the Index. The MSCI EAFE Index was provided on an “as is” basis. MSCI, each of its affiliates and each other person involved in or related to compiling, computing or creating the MSCI EAFE Index (collectively, the “MSCI Parties”) expressly disclaim all warranties (including, without limitation, any warranties of originality, accuracy, completeness, timeliness, non‐infringement, merchantability and fitness for a particular purpose). Without limiting any of the foregoing, in no event shall any of the MSCI Parties have any liability for any direct, indirect, special, incidental, punitive, consequential (including, without limitation, lost profits) or any other damages in connection with the MSCI EAFE Index or the SEADM Index. Prior to March 19, 2018, the SEADM Index was calculate by NYSE. Sector subsets of the Syntax Stratified LargeCap, Syntax Stratified MidCap, and SEADM Indices are calculated using model performance generated in FactSet, and as such may differ from index calculations performed by S&P Dow Jones Indices. The Affinity Thematics are the property of Syntax, LLC, which has calculated their performance using Affinity™. Syntax will not be liable for any errors or omissions in calculating the Affinity Thematics. Syntax®, Stratified®, Stratified Indices®, Stratified-Weight™, Stratified Benchmark Indices™, Stratified Sector Indices™, Stratified Thematic Indices™, Affinity™, and Locus® are trademarks or registered trademarks of Syntax, LLC and its affiliate Locus LP.
The S&P 500® Index is an unmanaged index considered representative of the US mid- and large-cap stock market. The MSCI EAFE Index is an unmanaged index considered representative of the European, Australian, and East Asian large-cap stock market. Benchmark data for the S&P 500, S&P 500 Equal Weight, S&P MidCap 400, S&P MidCap 400 Equal Weight, S&P SmallCap 600, S&P SmallCap 600 Equal Weight, and S&P Real Assets Equity Indices are provided by S&P Dow Jones through FactSet®. Benchmark data for the MSCI EAFE index is provided by MSCI through FactSet.