

A Next-Gen Approach to Risk-Managed Equity Using Momentum and Tactical Allocations
Executive Summary
Approaches to managing equity risk have become an important consideration for many long-term investors. The growth of defined-outcome and buffer strategies reflects a straightforward objective of staying invested in equity markets while reducing the impact of drawdowns. Over time, these approaches have moved from niche tools to widely used allocations. As a result, discussions of equity risk management increasingly focus on buffers, even though they represent only one way to manage risk within equities.
This paper provides a framework for evaluating the DF Risk-Managed Tactical Top 30 Index (DF RMT30) alongside buffer strategies, using the Cboe S&P 500 Buffer Protect Index Balanced Series (SPRO)1 as a representative laddered buffer construct. The framework focuses on how different approaches to managing equity risk are structured, the types of risks they are designed to address, and how they tend to behave across market environments. DF RMT30 manages risk through changes in exposure across bearish market regimes, while buffer strategies define outcomes over fixed outcome periods through predefined payoff profiles.
Buffer strategies define equity risk over a fixed outcome period, most commonly one year. Over that period, they aim to preserve participation in equity markets while providing a predefined buffer against initial losses. The buffer is financed by selling a portion of upside participation through options, which results in a capped return that is established at the start of each outcome period.
Laddered implementations such as SPRO improve usability for ongoing allocations by spreading exposure across overlapping outcome periods rather than relying on a single entry date. While this reduces sensitivity to timing, it does not alter the underlying economics. Upside participation remains capped, and realized outcomes continue to depend on entry point and market path over the defined period.
DF RMT30 takes a different approach to managing equity risk by focusing on exposure decisions across market regimes rather than defining outcomes over a fixed period. The strategy combines a concentrated mega-cap momentum equity portfolio with a rules-based allocation framework that shifts the allocation fully between equities and short-term U.S. Treasuries based on trend conditions in the broad mega-cap market. Risk management is achieved through these exposure shifts rather than through predefined, capped payoff structures. When conditions are favorable, the strategy maintains uncapped participation in equity markets. When conditions deteriorate, it seeks to reduce exposure during sustained downtrends in order to limit drawdowns and improve full-cycle outcomes.
These structural differences translate into distinct return patterns over time. From December 31, 2015 through December 31, 2025, DF RMT30’s total return index increased by approximately 349%, compared with approximately 170% for SPRO Balanced, based on index-level results and before product fees and implementation frictions. The gap varies across horizons and market environments in a manner consistent with how the strategies are constructed. Buffer strategies reflect capped upside and outcome-period dynamics, while DF RMT30 reflects uncapped participation during favorable regimes and explicit de-risking during extended downturns. This distinction informs how each approach fits within a broader equity allocation.
Exhibit 1: Framework for selecting equity risk management approaches

Key highlights
- Buffer strategies frame equity risk over a defined outcome period, most commonly one year.
- Laddered implementations improve usability for ongoing allocations but retain capped upside and outcome-period path dependence.
- DF RMT30 manages equity risk through regime-based exposure, combining mega-cap momentum selection with a tactical allocation to short-term U.S. Treasuries during sustained downtrends.
- Buffers are typically used to manage short-term drawdowns, while DF RMT30 is designed to support full-cycle equity participation and drawdown recovery across market regimes.
- From December 31, 2015 through December 31, 2025, DF RMT30 increased approximately 349% versus approximately 170% for SPRO Balanced, based on index-level results and before product fees and implementation frictions.
- In portfolio construction, DF RMT30 may complement buffer allocations or serve as an alternative equity risk-management approach, depending on the mandate’s time horizon and risk objective.
The Rise of Buffer Strategies and Why They Matter
Buffer strategies, often grouped within the broader defined-outcome category, have emerged in response to a persistent allocator challenge. Many investors want to remain invested in equity markets, but they also want outcomes that are easier to oversee and implement with discipline through drawdowns. For institutions and advisor platforms operating under behavioral, reputational, or near-term liability constraints, the path of returns can matter as much as the final outcome. Buffer strategies address this tension by defining equity payoffs over a fixed outcome period rather than relying solely on continuous exposure.
The rise of the category matters because it increasingly anchors how equity risk management is discussed in practice. In many conversations, option-based buffers are treated as the primary, or even the only, form of risk management within equities. Before comparing buffers with regime-managed approaches such as DF RMT30, it is useful to establish a clear, mechanism-based understanding of what buffer strategies are designed to do, how they are implemented, and the trade-offs inherent in their structure.
Category evolution and scale
Option-based payoff design is well established within structured products and overlay programs. The more consequential development has been implementation at scale. The ETF wrapper has made defined-outcome strategies broadly accessible through exchange-traded vehicles with intraday secondary-market liquidity on trading days and a standardized creation and redemption process. This shift has improved transparency and operational usability relative to bespoke structures.
Publicly reported asset figures illustrate the category’s growth, although reported totals are not directly comparable across sources. Vest traces the launch of the first buffer fund to 2016 and cites Morningstar category data indicating that, as of March 31, 2025, the “buffer funds” category included more than one hundred funds with assets exceeding $62 billion.2 Innovator entered the category in 2018 and reports managing more than $29 billion in defined-outcome ETF assets as of November 30, 2025.3 Goldman Sachs’ acquisition announcement provides a further institutional reference point, describing Innovator as managing $28 billion of assets under supervision across 159 defined-outcome ETFs as of September 30, 2025.4
The Goldman–Innovator transaction further clarifies how institutions are likely to view the durability and trajectory of the category. Financial Times reporting characterized the defined-outcome ETF market as approaching $50 billion and noted rapid growth since 2020, alongside a reported $2 billion acquisition price for Innovator.5 Goldman’s own announcement reinforces the strategic commitment to scaling defined-outcome ETFs within a broader asset-management platform.4 For allocators, the implication is that competition and product variety are likely to increase, and that buffers will remain a prominent reference point in platform construction and portfolio design.
How buffer strategies work
Buffer strategies generally define the equity payoff over a fixed outcome period, most commonly 12 months, by providing a predefined buffer against initial losses in exchange for reduced upside participation. This trade-off is implemented through options-based payoff structuring, with downside protection financed by selling a portion of equity upside. The buffer level is determined by strategy design, while the degree of upside participation is set at the start of each outcome period based on prevailing market conditions reflected in option pricing.
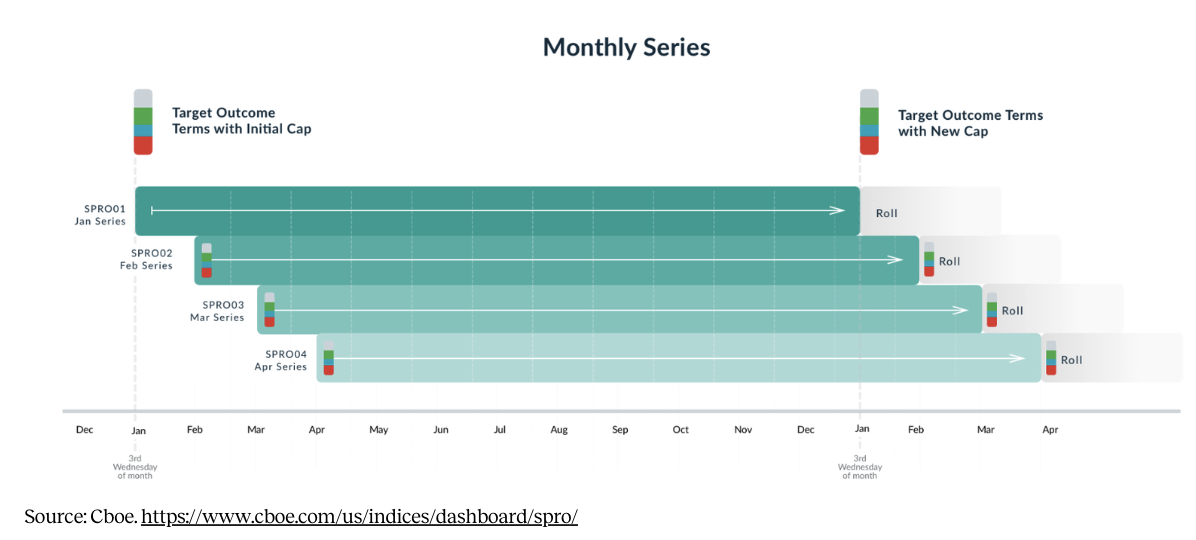
SPRO provides a useful reference implementation because it represents a rules-based, laddered buffer design at the index level. Cboe’s methodology describes the Cboe S&P 500 Buffer Protect Index Series as measuring the performance of a portfolio of hypothetical options based on the S&P 500 Index, where each series seeks to buffer the first 10% of losses over a period of approximately one year while providing participation up to a capped level.6 The SPRO factsheet further describes the Balanced Series as an equal-weighted composite of 12 monthly series, resulting in a laddered exposure across overlapping one-year outcome periods.7
Exhibit 2: Hypothetical stylized one-year buffer payoff profile

Exhibit 3: Laddered structure of SPRO Balanced
What buffers do well and the trade-offs
Buffer strategies are often most effective when an allocator’s primary objective is to frame equity risk over a defined horizon with a payoff profile that is straightforward to explain and implement with discipline. Innovator’s investor guide describes Buffer ETFs as reshaping the return profile by trading upside participation for a built-in buffer against loss over a defined outcome period.8 For investors with a fixed time horizon, near-term liability framing, or a strong aversion to drawdowns, that clarity can support more consistent implementation and reduce the likelihood of reactive de-risking during periods of market stress.
The trade-offs follow directly from the structure of buffer strategies. Upside caps serve as the economic mechanism that finances downside protection, which means participation in strong equity markets can be limited once the strategy reaches its maximum upside. When this dynamic is repeated across successive outcome periods, it can meaningfully affect long-run compounding. Buffer strategies introduce outcome-period path dependence, meaning results are most intuitive when the holding period aligns with the defined outcome period. When positions are entered or exited mid-period, realized outcomes can differ from a simple “10% buffer” framing because performance depends on the reference asset’s value at the end of the outcome window. Vest emphasizes that buffers are designed to protect an investment over a specific outcome period, while allowing investors to transact during that period.9
The growth of the category has also increased selection complexity. Investors now face expanding menus of tickers differentiated by choices with regard to buffer level, cap structure, reference asset, and maturity schedule. This breadth has made buffers more flexible as a toolkit, but it has also increased the importance of explicit decision rules around which designs are being used and why.
Taken together, these characteristics position buffers as horizon-based tools within the broader equity risk-management toolkit. This framing establishes the appropriate lens for comparison with DF RMT30, which manages equity risk through exposure decisions across market regimes rather than through outcome-period payoff structures.
DF Risk-Managed Tactical Top 30 Index Design Overview
DF RMT30 is designed to maintain exposure to equity markets while managing the risk of extended market drawdowns through changes in exposure as market conditions evolve. Rather than defining outcomes over a fixed outcome period, DF RMT30 manages equity exposure through a combination of momentum-based constituent inclusion and allocation shifts to short-term U.S. Treasuries during sustained market declines. This design reflects a deliberate choice to prioritize full participation in equity markets when conditions are supportive and to reduce exposure during prolonged periods of market stress, with the objective of improving full-cycle outcomes rather than smoothing short-term volatility.
DF Tactical Top 30 Equity Engine
The equity component of DF RMT30 is designed to capture persistent leadership within the U.S. equity market while maintaining a clear connection to the market’s dominant sources of return. The strategy draws from a defined universe of the largest 100 U.S. stocks, as represented by the Syntax US MegaCap 100 Index. This universe reflects the core of U.S. equity market capitalization and liquidity, anchoring the strategy’s equity exposure in companies that account for a significant share of market returns.
Within this universe, constituent inclusion is determined by a rules-based momentum ranking. All 100 stocks are ranked quarterly using an exponential moving average–based momentum score, and the top three deciles are retained in the index. Rather than equal-weighting the resulting 30 stocks, the methodology redistributes the aggregate weight of the bottom seven deciles proportionally across the retained names. This approach preserves the overall structure of the mega-cap market while expressing a deliberate momentum tilt through both inclusion and weighting.
Exhibit 4: Momentum-based constituent inclusion and weight redistribution

This construction has important implications for how the equity component behaves through time. Since constituent inclusion and weighting are driven by relative momentum within the mega-cap universe, sector exposure and concentration are not static. Leadership shifts naturally translate into changes in portfolio composition, allowing exposure to rotate across sectors and dominant stock cohorts as market conditions evolve.
Exhibit 5: Sector exposure shifts resulting from momentum-based equity selection

The resulting variation in sector and cohort exposure has important implications for how the equity component behaves across market environments. Periods of narrow leadership can lead to higher concentration, while broader participation tends to produce a more diversified exposure profile. This behavior reflects the design choice to allow exposure to adapt to prevailing market structure rather than remain fixed. The management of extended drawdown risk is incorporated at the index level through the allocation framework, which shifts exposure to short-term U.S. Treasuries during sustained periods of market stress.
The momentum process is designed to be systematic and adaptive, with an emphasis on capturing durable trends rather than reacting to short-term price movements. The quarterly rebalance cadence reflects this orientation, treating momentum as a persistent market characteristic rather than a timing signal. The cadence naturally limits the frequency of changes in constituent inclusion and weighting, supporting a more stable implementation profile while remaining responsive to meaningful shifts in relative momentum.
Allocation Framework and Regime Management
The allocation framework is the component of DF RMT30 that manages exposure across equity market regimes. It is designed to address extended drawdown risk by shifting the index’s allocation between equities and short-term U.S. Treasuries based on observable trend conditions in the broad mega-cap market. The overlay operates at the index level and is intended to complement the underlying equity construction, rather than altering its constituents or weights.
The allocation structure is binary by design, with the index fully allocated either to the equity basket or to short-term U.S. Treasuries at all times. Exposure is adjusted through discrete regime shifts rather than incremental scaling, reflecting a clear distinction between risk-on and risk-off conditions. This approach emphasizes sustained changes in market trend rather than continuous adjustment in response to short-horizon market movements.
Exhibit 6: Conceptual binary allocation framework according to asymmetric rules

The signals that drive this allocation decision are derived from exponential moving averages of the Syntax US MegaCap 100 Total Return Index. Two distinct signal pairs are used, reflecting different objectives depending on the current allocation state. When the index is allocated to equities, a long-term trend signal is monitored to identify sustained market deterioration. When the index is allocated to Treasuries, an intermediate-term signal is used to identify a meaningful improvement in trend conditions. This asymmetric signal design reflects the different considerations involved in exiting risk versus re-entering it.
Once a signal is generated, allocation changes take effect at the open on the second trading day following the signal date. This implementation convention introduces a consistent delay between signal observation and execution, ensuring that changes occur on a standardized schedule rather than intraday or same-day.
The allocation framework is designed to engage only during sustained periods of market deterioration, resulting in relatively few allocation changes over time. In historical backtests, bearish signals occurred during a small number of extended drawdowns, including the early-2000s technology downturn, the Global Financial Crisis, and the 2022 technology-led market decline. Outside of these periods, the index remained allocated to equities, allowing the equity component to drive performance during prolonged favorable market regimes.
Exhibit 7: Historical time spent in equities and short-term U.S. Treasuries

The allocation framework provides a regime-management layer that responds to sustained changes in market conditions through discrete allocation shifts. Through this design, the index adjusts its equity exposure during extended periods of market stress while remaining fully allocated to equities across most market environments.
Performance and Regime Behavior
The historical behavior of DF RMT30 reflects the interaction between its momentum-driven equity component and its regime-based allocation framework. Since 2001, backtested results indicate that the index generated higher annualized returns than both the Syntax US MegaCap 100 and the S&P 500, while exhibiting lower realized volatility over the full sample period and materially shorter drawdown and recovery durations. These outcomes vary meaningfully across market regimes, consistent with the index design.
Exhibit 8: Allocation Framework Adds Considerable Value Through Market Cycles

A regime-based perspective helps clarify how the allocation framework affects index behavior across market environments. During extended equity downturns, including the early-2000s drawdown and the Global Financial Crisis, shifts to short-term U.S. Treasuries materially altered the drawdown and recovery profile relative to a fully invested equity benchmark. In contrast, during prolonged bull markets, the index remained fully allocated to equities and behaved similarly to its underlying momentum-driven equity exposure.
Exhibit 9: Allocation Framework Impacts by Market Cycle


This pattern is consistent with the index design. DF RMT30 adjusts exposure during sustained changes in market conditions while remaining fully allocated to equities across most favorable environments. As a result, differentiation relative to fully invested equity benchmarks tends to emerge most clearly during periods of sustained market trends, when changes in exposure materially affect drawdown and recovery dynamics.
The historical evidence supports DF RMT30 as a long-term equity allocation that integrates regime awareness into its index design. Its performance profile reflects an emphasis on full-cycle behavior, drawdown management during extended downturns, and participation in sustained equity advances, rather than short-term optimization or defined-outcome structures.
DF RMT30 and Buffer Strategies in Comparison
Recent Performance Overview:
Over the period from December 31, 2015 through December 31, 2025, DF RMT30’s total return index gained approximately 349%, compared with about 170% for the SPRO, based on index-level results and before product fees and implementation costs. On an annualized basis, this corresponds to roughly 16% for DF RMT30 and about 10% for SPRO Balanced. These differences provide context for the analysis that follows, but do not, on their own, explain the structural drivers behind the outcomes.
Exhibit 10: Long-term compounding impact on exposure allocation vs. buffers

Shorter-horizon results show a similar, though more variable, pattern. Across YTD, 1-year, 3-year, and 5-year periods, DF RMT30 has generally delivered higher returns than SPRO Balanced, with the magnitude of the difference varying by market environment. These observations frame the comparison but require a structural explanation to understand why the outcomes diverge.
Exhibit 11: Return behavior across investment horizons

Rolling 1-year, 3-year annualized, and 5-year annualized returns for DF RMT30 and SPRO Balanced, shown alongside fixed-window annualized returns over 1-, 3-, 5-, and 10-year horizons. Results are index-level and gross of product fees and implementation costs. Rolling returns are shown for illustrative purposes and do not represent forecasts.
Structural Differences in Risk Management
The observed performance differences are best understood through the lens of structural design. DF RMT30 and SPRO manage equity risk in fundamentally different ways, reflecting different assumptions about time horizon, path dependence, and how drawdowns are experienced and managed.
DF RMT30 manages equity risk by adjusting exposure in response to sustained changes in market trend. In the absence of sustained market declines, the index remains allocated to a momentum-driven mega-cap equity basket. When longer-term trend signals indicate a persistent market decline, exposure shifts fully to short-term U.S. Treasuries. Upside participation is uncapped while the index remains allocated to equities, with differences in drawdown and recovery behavior arising from exposure changes rather than predefined payoff constraints.
By contrast, SPRO and similar buffer indices manage equity risk through option-based payoff design. Index exposure is to portfolios of S&P 500 options arranged in a laddered structure, with each sleeve defining a buffer and an upside cap over a specific outcome period. Risk mitigation is achieved by limiting losses over that period in exchange for capped upside, and realized outcomes are inherently tied to entry timing and the progression of each outcome window.
Exhibit 12: Structural comparison of DF RMT30 and SPRO

Note: Characteristics reflect index design and methodology and are illustrative of structural differences, not performance outcomes.
Risk and Drawdown Profile
These structural differences lead to distinct drawdown and recovery behavior. DF RMT30’s drawdown profile reflects the interaction between its momentum-driven equity component and its allocation framework. During extended equity downturns, shifts to short-term U.S. Treasuries altered the depth and duration of drawdowns relative to a fully invested equity benchmark, resulting in shorter recovery periods in historical backtests. During other environments, the index remained fully allocated to equities, allowing market returns to compound.
By contrast, SPRO has historically reduced volatility and drawdown depth relative to a fully invested equity benchmark, reflecting the impact of predefined buffers. However, it has still experienced meaningful drawdowns and extended recovery periods before reaching new highs, particularly when losses exceeded the buffered range or when recoveries occurred during periods of capped upside.
Exhibit 13: Comparative Performance During S&P 500 Drawdown, Rebound, and Recovery Periods

Performance Across Market Environments
Viewing performance through the lens of market environments helps clarify how DF RMT30 and buffer-based approaches differ in practice. During extended equity downturns, DF RMT30 historically differentiated itself by shifting fully into short-term U.S. Treasuries as sustained market declines were identified, altering drawdown and recovery dynamics relative to a fully invested equity benchmark. Buffer strategies also reduced losses in these environments, but in many cases still experienced meaningful drawdowns, particularly when losses exceeded the buffered range or when recoveries occurred during periods of capped upside.
During sustained equity market advances, buffer strategies often lagged fully invested equity exposure due to upside caps, while DF RMT30 remained fully allocated to equities and participated in market gains. Differences were less pronounced in environments characterized by sharp drawdowns followed by rapid recoveries, where buffer strategies provided short-horizon loss protection and DF RMT30’s behavior depended on whether market conditions persisted long enough to trigger a change in exposure.
Across these environments, the observed differences reflect structural design choices rather than tactical decision-making. DF RMT30 adjusts exposure in response to sustained changes in market conditions, while buffer strategies reshape payoff profiles over defined outcome periods. These distinctions explain why performance differences tend to emerge most clearly during prolonged market trends and are less pronounced during short-lived or rapidly reversing market moves.
Exhibit 14: Expected behavior across market environments

The comparison underscores a fundamental distinction between the two approaches. Buffer strategies are designed to manage horizon-specific loss risk through predefined payoff structures, while DF RMT30 manages drawdown behavior through changes in exposure as market conditions evolve. This difference in design orientation shapes how each approach behaves across market environments and clarifies their respective roles within a broader equity allocation.
Portfolio Considerations for DF RMT30 and Buffer Strategies
Framing the Investor Problem
The choice between DF RMT30 and buffer-based strategies is generally framed around two dimensions that consistently shape equity allocation decisions: time horizon and risk objective. These dimensions determine not only how risk is defined, but also which design trade-offs are appropriate.
Time horizon distinguishes between allocations with a defined end point and those that are open-ended. Investors with a fixed horizon often care most about the distribution of outcomes at a specific date, while investors with open-ended horizons are more concerned with compounding, recovery from drawdowns, and long-run capital growth.
Risk objective further differentiates these use cases. Some investors prioritize limiting short-horizon losses and achieving defined outcomes, particularly when capital will be deployed or spent within a known time frame. Others prioritize long-term capital growth, placing greater emphasis on drawdown recovery and compounding across market cycles, and accepting interim volatility in pursuit of improved full-cycle outcomes. DF RMT30 and buffer strategies are designed to address these differing objectives and therefore occupy distinct positions within the equity allocation toolkit.
When DF RMT30 Is Most Appropriate
DF RMT30 is generally best suited to open-ended equity allocations where the primary objective is long-term capital growth with explicit attention to drawdown depth and recovery dynamics. It is designed for use in allocations that span multiple market cycles and that the most consequential risks arise from deep, prolonged drawdowns. The index addresses this risk by shifting exposure to short-term U.S. Treasuries during sustained market declines, altering drawdown and recovery behavior while preserving participation in equity advances across most market environments.
Common use cases likely include core growth allocations, risk-managed equity sleeves within balanced portfolios, and institutional portfolios where maintaining exposure while avoiding extended periods below prior peaks is a main concern. DF RMT30’s regime-based allocation framework allows it to remain fully invested in equities during most favorable market environments while shifting to short-term U.S. Treasuries during sustained market declines, supporting improved full-cycle outcomes over long horizons without relying on predefined payoff constraints.
When DF RMT30 Is Most Appropriate
Buffer strategies are generally best suited to situations where investors require a clearly defined payoff range over a specific outcome period. Their design provides a known buffer against losses over an outcome window, which can be particularly valuable when capital will be deployed, reallocated, or spent within that window.
Common use cases include near-term liabilities, pre-retirement or early retirement transition periods, and situations where investors place a high value on outcome certainty at a specific date. In these contexts, the trade-off of capped upside in exchange for defined downside protection is often acceptable and may support more consistent implementation discipline during periods of market stress.
Buffer strategies can also serve as complementary tools within broader portfolios, particularly when deployed in laddered structures to manage entry timing across outcome periods. Their primary strength lies in defining payoffs over a specified horizon, rather than in supporting long-term compounding or recovery from multi-year drawdowns.
Illustrative Portfolio Contexts
The following examples are illustrative and are intended to highlight how DF RMT30 and buffer strategies may be considered within different portfolio contexts based on investment horizon and risk objective. They are not recommendations and do not represent actual client allocations.
Risk-managed equity sleeve within a balanced portfolio
Consider an advisor constructing a risk-managed equity sleeve within a balanced 60/40 portfolio. Using DF RMT30 within a portion of the equity allocation would incorporate systematic exposure adjustments across market conditions while preserving long-term upside participation. While certain buffer-based strategies may exhibit higher Sortino ratios due to explicit downside truncation, portfolios incorporating DF RMT30 have historically delivered relatively higher long-run returns with slightly higher overall volatility relative to traditional balanced allocations, resulting in improved Sharpe ratios. In this context, DF RMT30 offers an alternative approach to risk management that emphasizes participation and adaptability rather than predefined outcome constraints, which can support attractive risk-adjusted outcomes over a full market cycle.
Exhibit 15: Risk and Return Characteristics of Hypothetical Portfolio Mixes


Investor with a defined three-year spending goal
For an investor planning a home purchase or other significant expenditure in approximately 3 years, a buffer ETF ladder may be more appropriate. The fixed horizon and defined spending need align well with outcome-period payoff structures that provide a known buffer against losses over that window. In this context, DF RMT30 is probably less aligned, as it is designed for open-ended equity exposure rather than near-term capital preservation.
Institutional portfolios with endowment- or foundation-style objectives
Institutions with objectives focused on long-term capital growth with risk controls may consider DF RMT30 as part of a growth allocation. The index is always fully allocated either to the equity basket or to short-term U.S. Treasuries, and its transparent rules-based design and long history of modeled data support integration into policy portfolios. Compared with managing multiple buffer tickers across vintages and structures, DF RMT30 offers a single, transparent exposure that addresses drawdown and recovery behavior through allocation shifts rather than predefined payoffs. Given endowment and foundation portfolios are often very equity centric, the potential drawdown protection is an attractive hedging component, while not incurring the hedging costs and limited upside embedded in buffered products.
Across these possible portfolio scenarios, DF RMT30 and buffer strategies address different, though sometimes overlapping, investor needs. DF RMT30 manages drawdown and recovery behavior through changes in exposure over time, while buffer strategies are oriented toward managing horizon-specific loss risk through predefined payoff structures. Framed this way, the two approaches function as potentially complementary tools within a broader equity allocation toolkit, with appropriate use cases determined by time horizon, risk objective, and portfolio context.
Conclusion
DF RMT30 and buffer strategies address different dimensions of equity risk, reflecting different assumptions about time horizon, path dependence, and how drawdowns are best managed. DF RMT30 approaches risk management through changes in exposure across market conditions, emphasizing drawdown recovery and full-cycle behavior rather than outcome certainty at a single point in time. Buffer strategies focus on defining outcomes over a specified period, offering horizon-specific loss protection in exchange for capped upside.
This distinction becomes increasingly relevant in an environment where buffer strategies have come to dominate the risk-managed equity narrative. As defined-outcome products proliferate, allocators are often presented with solutions framed primarily around defined payoffs and relatively short time horizons. DF RMT30 reframes the discussion toward market dynamics, recovery from prolonged drawdowns, and the role of adaptive exposure within long-term equity allocations.
From a portfolio construction perspective, DF RMT30 offers a different set of practical attributes. The index maintains full allocation either to equities or to short-term U.S. Treasuries, with transparent, rules-based mechanics and daily index levels. Upside participation is uncapped when the index is allocated to equities, and drawdown and recovery behavior is shaped through exposure shifts rather than predefined payoff constraints. These characteristics support straightforward communication of what the index is designed to do and, equally important, what it is not designed to deliver.
Used in this context, DF RMT30 can complement buffer strategies within broader portfolios or serve as a clean alternative for allocations where long-term compounding, recovery dynamics, and systematic exposure are the primary objectives. Its role is not to replace defined-outcome tools, but to address a different, though overlapping, set of investor needs. Framed appropriately, DF RMT30 expands the toolkit available to allocators navigating the trade-offs between outcome certainty, drawdown experience, and long-horizon equity growth.