

Large-Cap Quality + Growth Index Case Study
How advisors can use Syntax Direct to build a fundamentally-driven large-cap core portfolio
Key Takeaways
- Quality and growth are the two most popular factor tilts among Syntax Direct advisors, appearing in roughly half of all custom factor builds on the platform.
- Over the full backtest period (12/15/2017 – 5/1/2026), the Syntax US LargeCap 500 Quality +Growth Tilt Index Model returned 17.31% annualized, outperforming the SY500 benchmark by 266 basis points per year.
- A hypothetical $1,000 invested at inception grew to $3,809 in the tilt model versus $3,142 in the benchmark. That is an additional $667 of cumulative return on the same starting capital.
- The strategy delivered higher risk-adjusted returns: 5-year Sharpe ratio of 0.66 vs. 0.60 for the benchmark, with a 0.96 correlation that keeps it recognizable as a core large-cap allocation.
- Syntax Direct allows advisors to build, backtest, and deploy this index in minutes, with full control over factor selection, conviction level, sector exposures, and rebalance schedule.
The Advisor Opportunity
When advisors first encounter direct indexing, the most common question is also the most practical: how do I build something that looks like the broad market, but does it better? Quality and growth are the natural starting point. Quality companies (those with stable earnings, low leverage, and high profitability) have historically produced more consistent returns through the cycle. Growth companies, with strong earnings trajectories and reinvestment opportunities, have driven a disproportionate share of long-term equity returns. Combining the two creates an index that is recognizable to clients (large- cap, US, well-known names) while pursuing the kind of fundamental edge that justifies a custom portfolio over a passive ETF.
Across more than 500 customer indices built on Syntax Direct, growth and quality are by a wide margin the two most frequently selected factors. This case study walks through how an advisor can use Syntax Direct to construct a Quality + Growth tilted large-cap index, examines the resulting portfolio, and presents the backtest performance against the broad large-cap benchmark.
Building the Index in Syntax Direct
Syntax Direct organizes index construction around a small set of strategy tiles. For an advisor building a tilted large-cap core portfolio, the Core tile is the appropriate starting point. The Core strategy reduces the number of holdings in a chosen benchmark while preserving its overall character, then applies any selected factor tilts on top. Exhibit 1 summarizes the design choices used in this case study.
Exhibit 1: Index Characteristics and Assumptions

The starting universe is the Syntax US LargeCap 500 Index (SY500), Syntax’s broad large-cap benchmark of comparable scope to the S&P 500. From this universe, the Core methodology selects 100 holdings, weighted by modified market capitalization. The factor engine then applies a multifactor combined tilt using the Growth and Quality factors at high conviction. High conviction more aggressively up-weights companies that score well on the combined factor and down-weights those that score poorly, with the degree of tilt applied within each sector.
Sector Exposures
The Quality + Growth tilt produces sector allocations that meaningfully differ from the broad benchmark, reflecting where high-scoring companies happen to concentrate. Exhibit 2 compares the sector weights of the tilted index against the SY500 as of the most recent rebalance.
Exhibit 2: Sector Allocations vs. SY500 Benchmark

Technology is the dominant overweight at 45.2% versus 33.4% in the benchmark, reflecting the concentration of large-cap quality and growth scores in software, semiconductors, and platform companies. Communications (18.0% vs. 10.8%) is driven by Alphabet and Meta, while Healthcare (12.1% vs. 10.2%) is concentrated in Eli Lilly. Consumer Discretionary, Financials, Industrials, and Energy are the principal underweights; these sectors historically score lower on the quality and growth combination.
Real Estate, Utilities, and Basic Materials also receive small allocations of less than 1%, consistent with their typically lower growth profiles. Advisors who want to constrain these sector tilts can layer in sector overweight or underweight controls in Syntax Direct without changing the underlying factor methodology.
Top 10 Holdings
Exhibit 3 lists the ten largest constituents of the index as of the most recent rebalance. The top three positions (NVIDIA, Alphabet, and Microsoft) together account for approximately 39% of the portfolio, reflecting the concentration of high-quality, high-growth scores in the largest mega-cap technology and platform names. The modified capitalization weighting tilts the portfolio toward the largest, highest- scoring names that anchor the portfolio.
Exhibit 3: Top 10 Holdings


Backtest Performance
Syntax Direct calculates backtests for indices modeled on the platform beginning on December 15, 2017. Exhibit 4 shows the hypothetical growth of $1,000 invested in the Quality + Growth Tilt Index Model and the SY500 benchmark from backtest inception through May 1, 2026.
Exhibit 4: Growth of $1,000: Quality + Growth Tilt vs. SY500 Benchmark

Over the full backtest period, the tilt model grew $1,000 to $3,809, representing an annualized total return of 17.31%. Over the same window, the SY500 benchmark grew the same $1,000 to $3,142, an annualized total return of 14.65%. The tilt outperformed by 266 basis points per year on a compound basis.
The two indices tracked closely through 2018 and the early-2020 pandemic drawdown. Meaningful divergence began in mid-2020, as quality and growth scores increasingly identified the technology and digital platform companies that benefited from the post-pandemic recovery. The tilt model was hit harder in the 2022 drawdown and subsequent value market, declining 25.4% on the calendar year versus 19.6% for the benchmark, reflecting the typical challenges of growth-tilted strategies in rising-rate environments. The tilt then sharply outperformed during the 2023–2025 recovery as growth rotated back into favor and quality balance sheets were rewarded amid AI-driven earnings acceleration, returning 42.1%, 30.7%, and 22.9% in those three years against benchmark returns of 27.1%, 25.9%, and 18.2%.
Exhibit 5: Performance and Risk Statistics

On a risk-adjusted basis, the strategy delivered a 5-year Sharpe ratio of 0.66 versus 0.60 for the benchmark, a modest improvement despite the higher absolute volatility (18.9% vs. 15.9% standard deviation). The 5-year beta of 1.14 indicates the index moves slightly more than one-for-one with the benchmark, consistent with its tilt toward higher-growth, more volatile sectors. The 0.96 correlation confirms that the strategy still behaves recognizably as a core large-cap allocation, suitable as a primary equity holding rather than a satellite position. Notably, the maximum drawdown of −32.5% was slightly shallower than the benchmark’s −33.8%, with both indices reaching their trough during the compressed 2020 COVID drawdown. All told, the long-term effect of reducing the security count to 100 and adding a high-conviction tilt to quality and growth was 5.62% tracking error against the original benchmark.
Exhibit 6: Calendar Year Total Returns

Index Fundamentals
The fundamental profile of the tilted index reflects its growth orientation. Exhibit 7 compares key fundamental metrics for the Quality + Growth Tilt Index Model and the SY500 benchmark as of the most recent rebalance.
Exhibit 7: Index Fundamentals: Quality + Growth Tilt vs. SY500 Benchmark
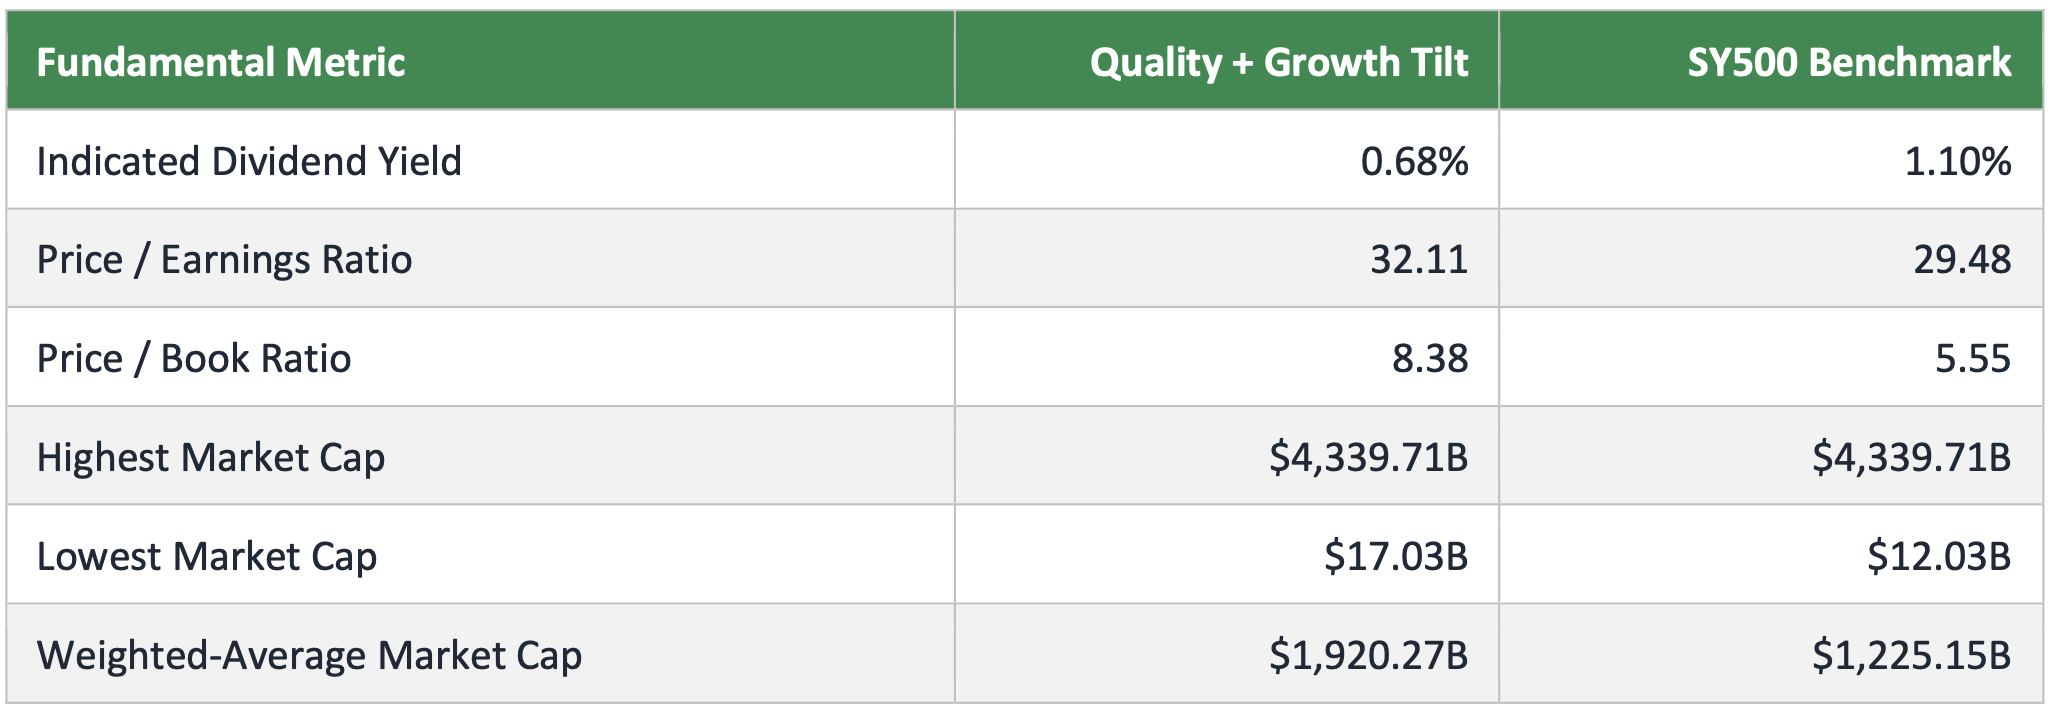
The dividend yield of 0.68% is roughly 42 basis points below the benchmark, reflecting both the technology overweight and the growth-factor preference for companies that reinvest earnings rather than return them as dividends. The price-to-earnings ratio of 32.1 is moderately elevated versus the benchmark’s 29.5, while the price-to-book ratio of 8.4 is approximately 50% higher than the benchmark’s 5.6, the latter being characteristic of growth-tilted portfolios where valuation ratios reflect the market’s pricing of future earnings power. The weighted-average market cap of $1.92 trillion is meaningfully higher than the benchmark’s $1.23 trillion, again reflecting the concentration of high- quality, high-growth scores among the very largest companies.
Putting It Into Practice
This case study illustrates how an advisor can use Syntax Direct to build a custom large-cap index that pursues a specific investment thesis (in this case, exposure to the highest-quality and highest-growth companies in the US large-cap universe) without sacrificing the breadth and recognizability of a core equity allocation. The platform handles the heavy lifting: factor scoring, sector-relative tilting, weight capping, rebalancing, and backtesting are all performed automatically based on the advisor's selections.
Beyond the basic construction shown here, Syntax Direct supports a wide range of additional customizations that can be layered onto this index design. Advisors can add controversial-industry exclusions for clients with values-based mandates, exclude specific tickers to manage concentration risk against client holdings, adjust the conviction level to dial the factor strength up or down, or extend the methodology to other universes including the Syntax 2000 small-cap index or, beginning in 2026, the Russell U.S. Index Family.
To learn more about Syntax Direct or to schedule a demo, please visit www.syntaxdata.com or contact sgrieco@syntaxdata.com.