

The lifecycle of many private, high-growth companies has shifted from the more typical "hand-off" between private and public markets to a "private-for-longer" model where companies are increasingly capturing vast appreciation while they remain private. This shift has created a dual-sided pressure: while companies stay private longer, institutional investors are running into allocation limits. Combined with a significant slowdown in the return of cash (distributions) due to the lack of IPO and strategic exits, managers are now pivoting towards retail investors to tap into an estimated $80 trillion pool of individual investor assets that have historically been under-allocated to private markets. Advisors are largely supportive of this shift. An Adams Street 2026 Advisor Outlook reports that 89% of financial advisors surveyed expect private markets to outperform public ones long term, with 70% planning to increase client exposure. For advisors, this transition requires moving beyond simple access to actively educating clients on the nuances and structural differences of private assets.
The Challenges with Valuing Private Companies
The primary hurdle in private markets for retail and institutional investors alike is the "transparency gap" that makes it difficult to determine the fair market value of an asset at any given moment. Unlike public companies, U.S. private firms have no regulatory requirement to disclose detailed financial data, forcing investors to rely on self-reported data from general partners (GPs). This also creates a valuation lag for private companies. Public stocks reflect new economic data and company specific news nearly instantly. In contrast, private assets suffer from stale pricing, with a company’s valuation being tied to a last funding round, or a GPs quarterly update or annual appraisal.
Understanding the Private Equity Market
There are roughly 300,000 private companies globally that are owned by private equity and venture capital funds. This universe includes everything from venture-funded, pre-revenue startups to established megacaps with billions in revenue. While the number of private companies is vast, the reality is there are presently roughly 400 firms with sufficient secondary transaction volume to establish reasonable valuations with sufficient interest and price discovery to support access for retail investors. The Syntax Private Index universe consists of 363 companies with an estimated market value of $5.5 trillion1.
Private Market Concentration Risk
The most liquid segment of the private equity market mirrors the S&P 500 in its significant security concentration, though the private universe is notably more top-heavy. While the S&P 500 is often cited for its reliance on a few mega-cap names, the Syntax Private Index shows a much higher density, with its top ten holdings representing 74% of the Index compared to 38% for the S&P 500 at the end of Q1. While "Unicorn" status ($1B+ valuation) was once the primary benchmark for success, roughly 270 companies of the 363 companies in the universe exceed this threshold. The Index currently includes 24 "Decacorns" ($10B+) and six "Centicorns" ($100B+), with the latter driving the concentration risk. The graph below highlights the Index’s top ten companies and their weight as a percent of the total market capitalization.
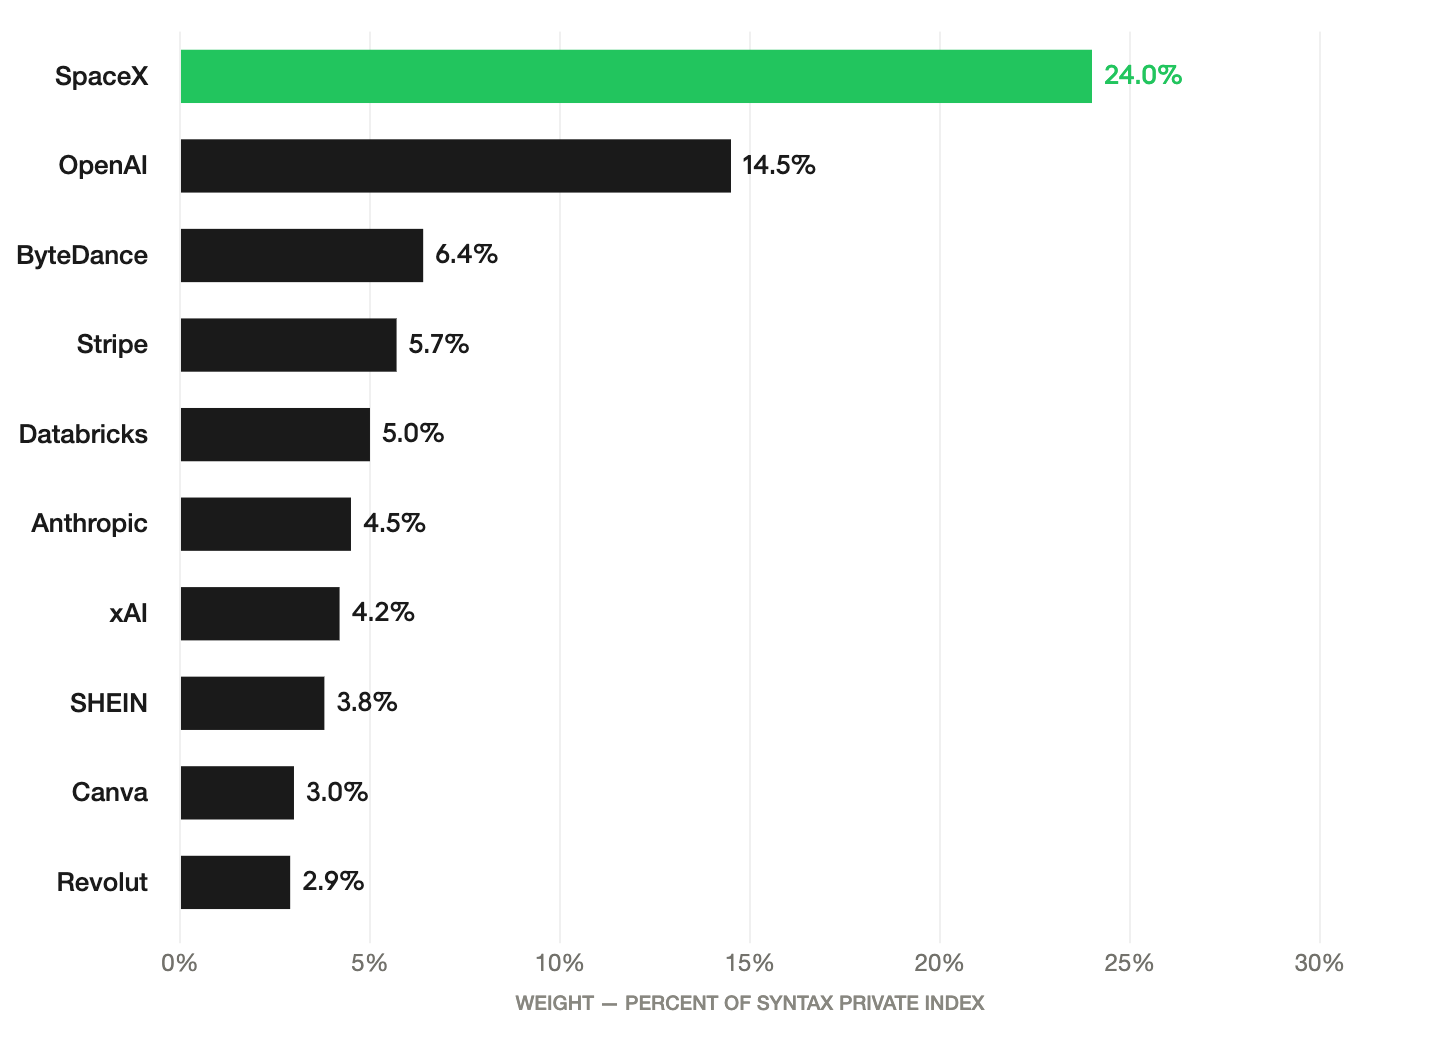
The private company universe mirrors the S&P 500 in sector concentration risk, too. Its largest sector is Technology at 42% compared to 33% for the public large cap index. This overweight to tech is likely to become even more pronounced in the not too distant future when SpaceX, representing 24% of the Index as an Industrial company, goes public.

Overall, the private markets have a higher degree of sector concentration risk than the U.S large cap market. Upwards of 97% of the Index is concentrated in just four of the 11 primary sectors: Technology, Industrials, Financials, and Communications.
The evolution of private markets is expanding retail investors’ access to a broader set of investment opportunities, while also introducing structural challenges such as limited liquidity and concentration risk. That said, the long-standing transparency and valuation gap between private and public assets is steadily narrowing. Advances in data aggregation, secondary market pricing, and index construction are delivering institutional‑grade insights to a wider audience. By improving access to high‑quality, timely data, technology is enabling investors to better assess risk, set realistic expectations, and make more informed decisions, helping to build a more transparent bridge that supports confident participation in the growing private markets ecosystem.
1. Company valuation data provided by MSCI Private Company Insights. Daily pricing is generated for private companies by aggregating proprietary bid, offer, and trade data from a consortium of leading broker-dealers and banks. In the absence of direct trading activity, a model-based approach combines funding round data with real-time performance trends.