

Key Takeaways
- The Syntax Stratified LargeCap Index (SYLC) gained 12.13% year-to-date through June 2026, outpacing the cap-weighted S&P 500's 10.21% return by 192 basis points. Results were driven by a resilient first quarter for SYLC that offset a slower second-quarter rebound.
- SYLC's balanced business-risk exposure cushioned the Q1 market shock (+1.83% vs. -4.33% for the S&P 500), while its lower technology weighting caused it to trail during Q2's AI infrastructure-led rally (+10.11% vs. +15.20%).
- SYLC's equal sector-weighting methodology diversifies business risk, helping it act as a complement to the S&P 500 and other large cap indices that share a growing reliance on a narrow set of dominant tech-focused companies.
Market and Performance Overview
In the first half of 2026, the performance of the U.S. large cap market played out in two acts. The first quarter tested investors’ resolve, and the second quarter rewarded their patience. Q1 is best described as a market shock as the S&P 500 lost 4.33% after recovering from a peak decline of 8.7%.1 While corporate earnings were strong, the U.S.-Israeli strikes on Iran in late February created market jitters as oil rose to a high point of nearly $120 a barrel2 creating a spike in inflation and rising yields. Once an early-April ceasefire was announced, the market recovered and the momentum of the broadening AI trade generated a 15.20% return for the S&P 500, its best quarter since 2020.
What made the Q2 rally interesting was it represented at least a partial change in the market’s tune. The Magnificent Seven, as measured by the performance of the Roundhill Magnificent Seven ETF (MAGS), were down 2.5% for the first six months of the year through June. This compares to a positive 10.2% return for the S&P 500.3 The ongoing infatuation with the Mag Seven paused as investors rotated capital towards the direct AI infrastructure beneficiaries like memory and storage chipmakers. Part of the song, however, remained the same: the market continued to be led by tech stocks. The S&P 500 Growth Index returned 21.89% in the quarter, widely outpacing its S&P 500 Value counterpart which returned 8.00%.
The Syntax Stratified LargeCap Index performed in line with expectations during both the first and second quarters, as shown in Exhibit 1. SYLC and its sector neutral approach to business risk generated a positive 1.83% return for the quarter, outperforming the cap-weighted S&P 500 return of -4.33% by roughly 600 basis points. The S&P’s decline was driven largely by the weak performance of the software industry, and specifically concerns that agentic AI would disintermediate enterprise software. Hence, the term “SaaSpocalypse” was coined. SYLC generated a strong 10.11% absolute return in Q2, but its lower tech weighting led to 509 basis points of underperformance relative to the S&P 500.
Exhibit 1: Near-Term U.S. Large Cap Market Performance (%)
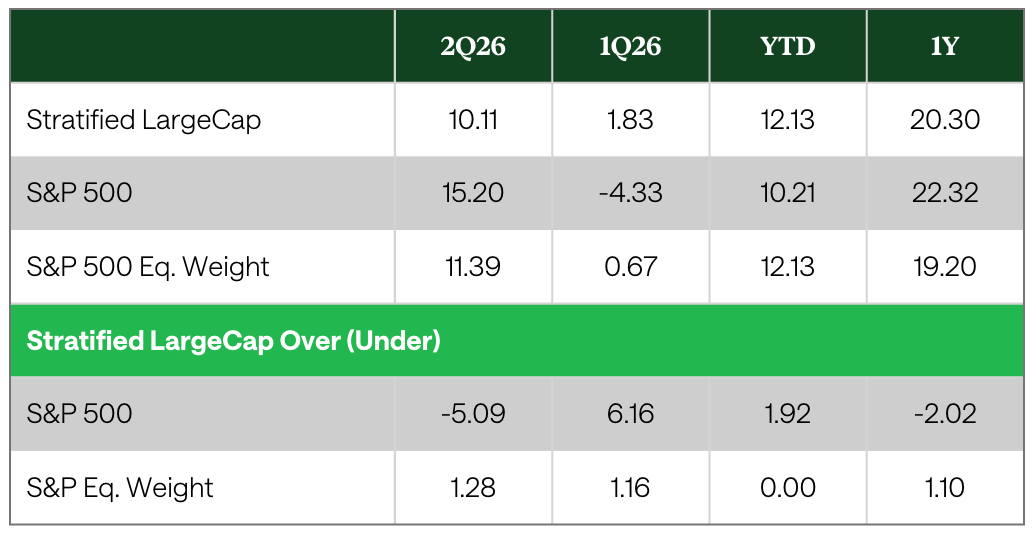
For the year-to-date through June 30, SYLC’s 12.13% return exceeded the S&P 500’s 10.21% results by 1.92 percentage points. For the trailing year, SYLC’s return of 20.30% trailed the S&P 500 by roughly two percentage points while outperforming the S&P 500 Equal Weight Index by slightly more than one percentage point.
The three to ten year trailing returns shown in Exhibit 2 highlight the cap-weighted S&P 500’s strong performance relative to both Stratified LargeCap and also the equal-weight S&P 500. Over the long-term, the Stratified LargeCap Index's since-inception results outpace both S&P indices.
Exhibit 2: Intermediate and Long Term Performance (%)
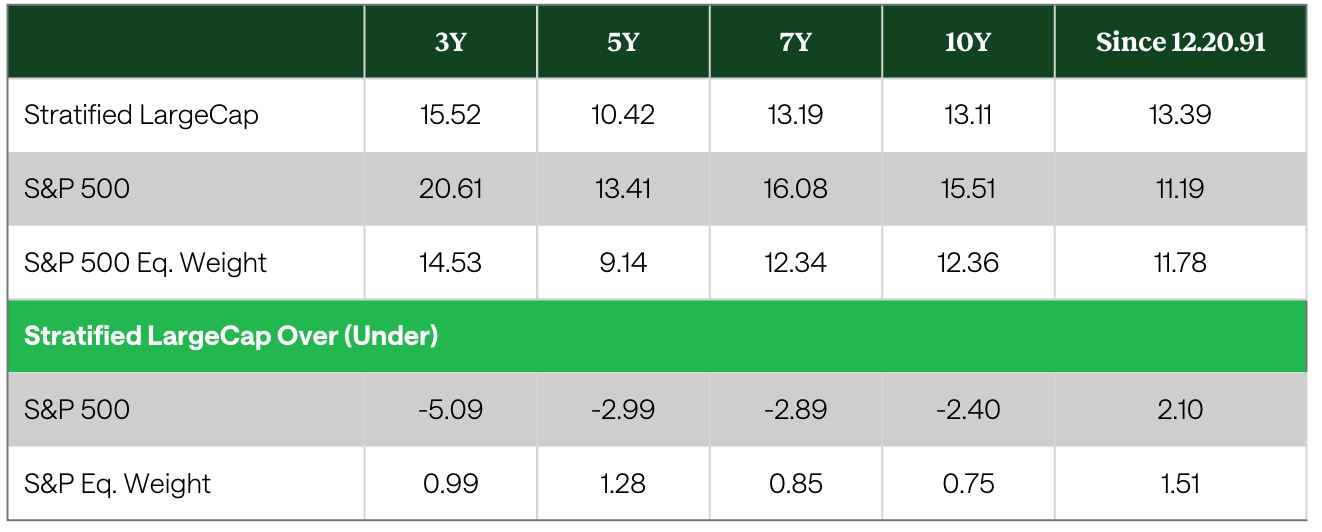
Even though SYLC has returned over 15% annually for the past three years, it trails the S&P 500’s 20.61% annualized return by roughly five percentage points. Over the past ten years, the annual underperformance difference is 2.40 percentage points.
Since the start of its backtest on December 20, 1991, excluding fees and expenses, SYLC has returned 13.29% annualized, 210 basis points ahead of the S&P 500's 11.19% return. This advantage traces largely to the first decade of the 2000s, when the cap-weighted S&P 500 lost nearly 10% of its value amid the collapse of the tech bubble and the Global Financial Crisis. SYLC's back-tested results produced an annualized return of 7.3% for the first decade of this century.
The full history results showed SYLC also exceeded the S&P Equal Weight performance by 1.5 percentage points annually, highlighting the benefits of balancing business risk vs. the weight of each security in the index.
Index Construction and Sector Exposure
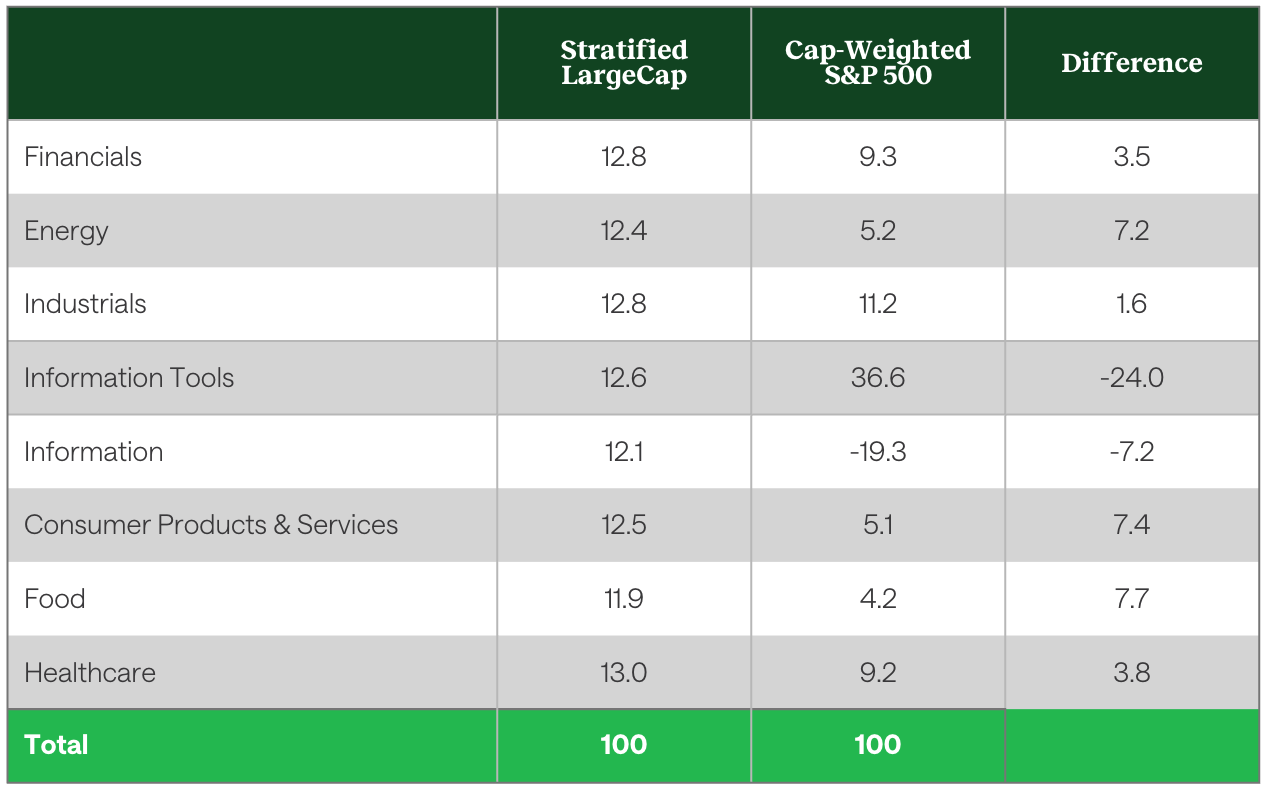
The goal of the Stratified LargeCap Index is to deliver an unbiased return that is representative of all the business opportunities in the market, not just the largest ones. The index holds the exact same stocks as the S&P 500; the only difference is the weighting scheme, which is designed to reduce concentration risk to both individual stocks and sectors. Exhibit 3 highlights the sector weights of the Stratified Large Cap Index and the cap weighted S&P 500. Highlights include:
- The Stratified LargeCap Index targets a weight of 12.5% to each of its eight sectors, defined using Syntax’s proprietary classification data and designed to enhance diversification when used in conjunction with Stratified Weight methodology. The sector variances shown below relative to the target weight are tied to market movements between the quarterly rebalance and quarter-end.
- The S&P 500 has about 56% of the index tied to two sectors: Information Tools (36.6%) and Information (19.3%). This highlights the narrowness of the large cap market and its continued overweighting of technology-related stocks.
- Stratified LargeCap maintains higher exposure to sectors that traditional cap-weighted indices underweight relative to their economic footprint. This includes Energy, Food, and Consumer Products & Services, which each represent between 4.2% and 5.2% of the S&P 500. The S&P 500's small allocation to Energy is particularly notable given its increasing linkage to hyperscalers and AI infrastructure. The Energy sector returned 20.6% for the year-to-date through June which was double the 10.1% S&P 500 return.
Exhibit 3: Sector Weights of Stratified LargeCap vs. Cap-Weighted S&P 500 (%)
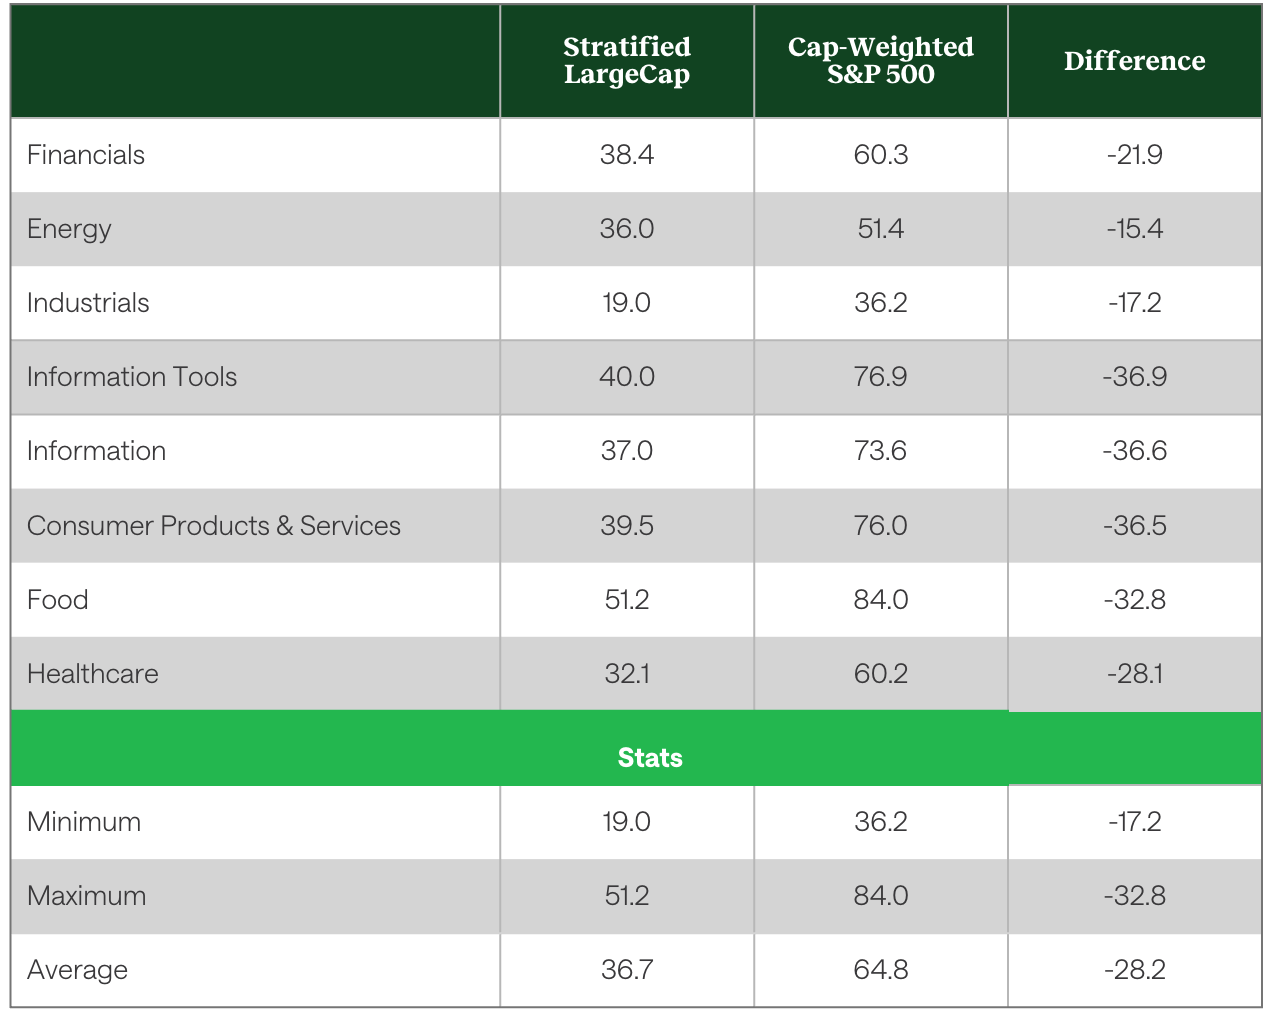
The S&P 500 is often singled out for its high level of concentration risk in its top 10 holdings and within technology. Often overlooked is the concentration of the largest companies within sectors outside of technology. Exhibit 4 looks at this dynamic as it compares the weight of the top 10 holdings within each sector for the Stratified LargeCap Index and the S&P 500.
Exhibit 4: Weight of Top 10 Securities Within Sectors: Stratified LargeCap vs. Cap Weighted S&P 500 Index (%)
The results show:
- The tech-related Information Tools (+76.9%) and Information (73.6%) sectors both have in excess of 70% of their sector weight in their top ten holdings. Interestingly, Consumer Products and Services is similarly very concentrated at 76.0%.
- Stratified LargeCap has an average weight of 36.7% to the top ten securities within each sector, substantially lower than the S&P 500’s 64.8% weight.
This further highlights the large-cap market’s reliance on the largest companies to drive returns. Conversely, Stratified LargeCap benefits when market participation broadens, as well as when performance in the largest sectors lags.
The index characteristics of Stratified LargeCap relative to the S&P 500 cap-weighted and equal-weighted indices are shown in Exhibit 5.
Exhibit 5: Index Characteristics: Stratified LargeCap, S&P 500 Cap-Weighted and Equal-Weight Indices
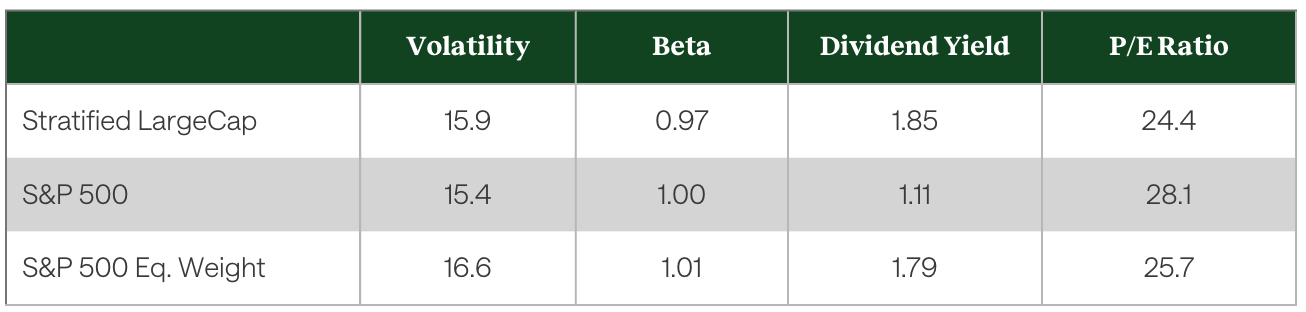
Stratified LargeCap’s historical volatility (15.9%) is modestly higher than the S&P 500 (15.4%), while its beta is similar (0.97 vs. 1.00). Not surprisingly, given its balanced business risk and lower weight to technology, it has a higher dividend yield (1.85% vs.1.11%) and lower P/E ratio (24.4x vs. 28.1x) than the S&P 500.
Conclusions
The Stratified LargeCap Index performed in line with expectations through the first two quarters of 2026. The balanced approach to distributing business risk cushioned performance during the market shock experienced in Q1 tied to the hostility between the U.S., Israel, and Iran. The Index generated a positive return of 1.8% vs. a 4.3% loss for the S&P 500 in Q1, and even though Stratified LargeCap underperformed in the AI led rally in Q2 (+10.1% vs. 15.2% for the S&P 500), it has outperformed for the year through June 30, returning 12.1% vs 10.2% for the S&P 500.
This pattern highlights the complementary nature of Stratified LargeCap relative to the S&P 500, not only for 2026 but over time. SYLC has historically lagged during periods when a narrow set of mega-cap names drives the market, and outperformed when participation broadens or when those same names falter, as its since-inception track record demonstrates. For investors and advisors seeking to weather more than a single market regime, SYLC can serve as a balancing mechanism within a portfolio to mitigate the single-name and sector-concentration risk embedded in cap weighted U.S. large cap equity indices.
- Source: CNN Business, "Dow closes in correction, S&P logs longest weekly losing streak in four years," March 27, 2026 — https://www.cnn.com/2026/03/27/investing/us-stocks-iran
- Source: CNBC, "A timeline of how the Iran war shook oil prices — and what comes next," April 21, 2026 — https://www.cnbc.com/2026/04/21/oil-price-iran-war-middle-east.html
- Source: Koyfin performance of MAGS ETF from 12.31.25 to 6.30.26