

Key Takeaways
The Russell 2000 is widely recognized as the industry standard benchmark for the U.S. small-cap market. This paper applies the Syntax FIS® Industry Classification System to this iconic index to generate insights into the breadth and depth of its underlying business exposures, uncovering nuances other classification systems overlook. Highlights include:
- The companies in the Russell 2000 span 245 distinct business activities and over 7,000 product lines.
- 71% of Russell 2000 companies derive the majority of their revenue from a single product line, a pure-play profile that makes small-cap stocks more focused, more transparent, and complementary to the diversified conglomerates that dominate the Russell 1000.
- The Russell 2000’s structural overweights in Industrials, Energy, Basic Materials, and Real Estate provide meaningful exposure to the physical economy, which is systematically underrepresented in large-cap indices dominated by software, platforms, and intangible assets.
- The Russell 2000 offers investors a fundamentally different risk and return profile from large-cap universes: broader sector balance, lower single-stock risk, and exposure to businesses well positioned to benefit from the next U.S. economic growth cycle.
Introduction
Large-cap stocks have commanded the most investor attention over the past 15 years — a focus that has been well-earned given their exceptional performance. However, investors with a longer view recall this has not always been the case. During the decade of the 2000s, the S&P 500 delivered a negative total return, losing approximately 9% in nominal terms and roughly 25–30% in real dollars when adjusted for inflation. Today, large-cap stocks are characterized by record levels of sector and individual stock concentration risk, as well as mounting valuation concerns. Against this backdrop, we believe it is an opportune time to take a deep dive into the Russell 2000 Index and examine the underlying business exposures that make it a genuine complement to large-cap portfolios.
Leveraging FIS®
For this analysis, we’ve utilized Syntax's Functional Information System (FIS®) and its six-level classification system shown in Exhibit 1. A distinguishing feature of FIS® is its ability to identify individual company exposures at the product line level, which can then be rolled up at the index or portfolio level. This provides a higher level of precision when compared to other industry classification systems where companies are rolled up based on their primary sector classification, regardless whether their exposure to that sector is 51% or 100% of revenues.
Exhibit 1: FIS® Sector Taxonomy
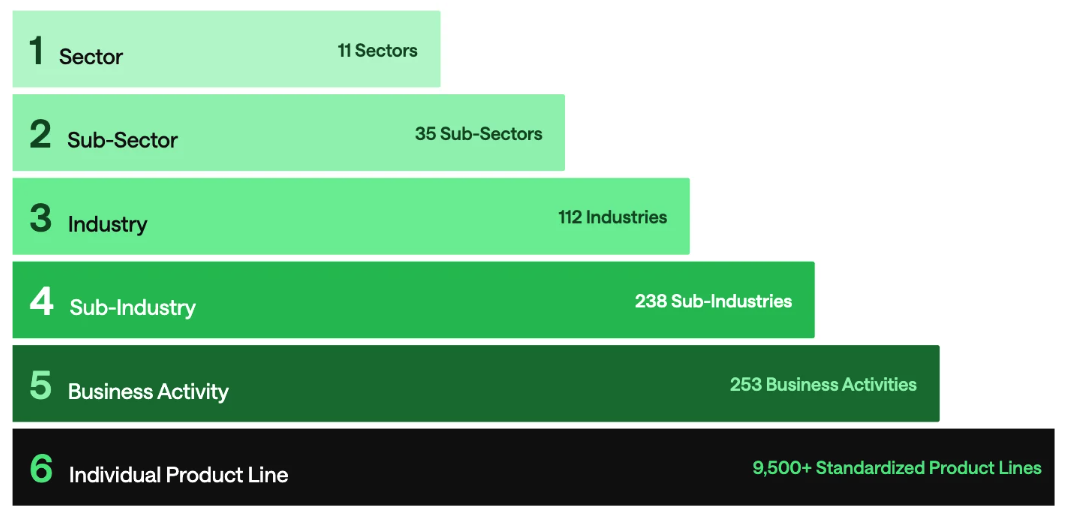
The FIS® classification system highlights the vast economic diversity within the Russell 2000. Exhibit 2 shows how the 11 sectors break down all the way to their product lines.
Exhibit 2: Russell 2000 Sector Classification Detail Down to Product Line
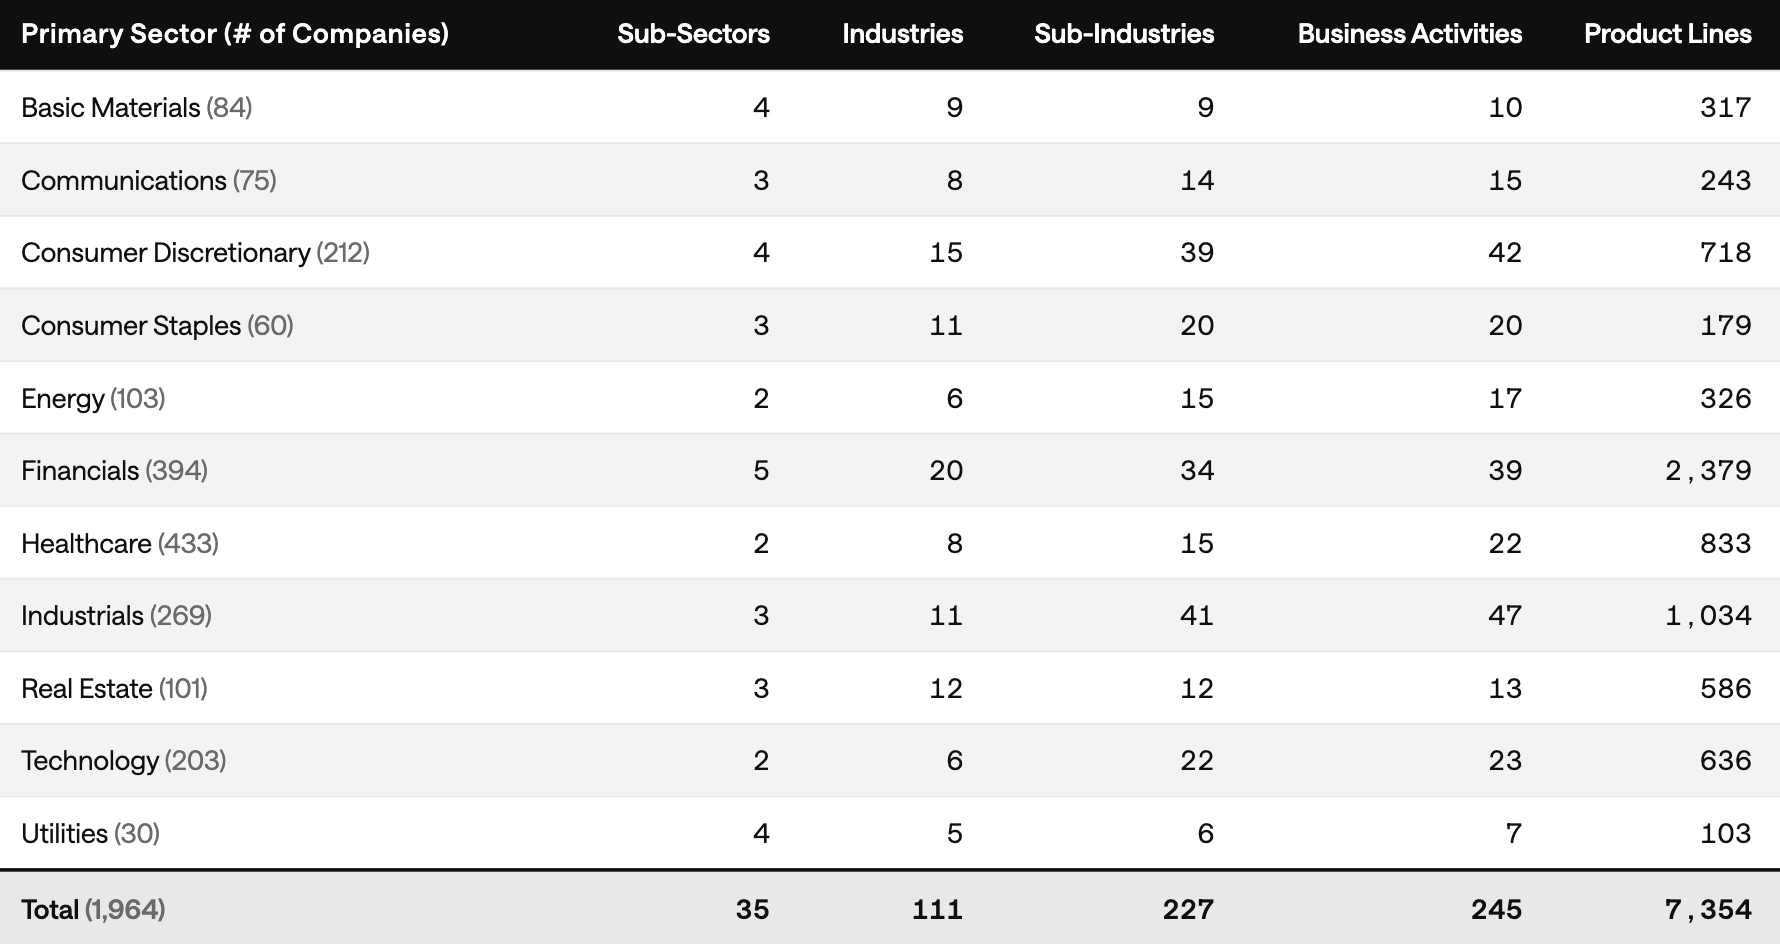
- Healthcare (433) and Financials (394) have the most companies by a considerable margin. For Financials, these totals are spread across five sub-sectors, versus two for Healthcare. According to FTSE Russell, Healthcare was the largest sector in the index as of the end of Q2, with a weight of 20% vs. 18% for Financials.
- Industrials (47) and Consumer Discretionary (42) lead in distinct business activities, but Financials dominates in product lines with 2,379 — a reminder that company count alone understates economic complexity.
- Utilities (30) and Consumer Staples (60) represent the smallest sectors by company count within the index.
In Exhibit 3, we evaluate the distribution of product lines for companies in both the Russell 2000 and Russell 1000. As expected, the small-cap universe skews more pure-play: 22% of Russell 2000 companies report just a single product line compared to 7% in the Russell 1000. The Russell 2000 has slightly more two product line companies (21% vs. 18%) and slightly fewer three-product-line companies (18% vs. 19%). The Russell 1000 has significantly more four product line companies (19% vs. 11% for the Russell 2000), while the results for five through nine product lines are similar across both indexes. The Russell 1000 has double the share of companies with ten or more product lines (8% vs. 4%).
Exhibit 3: Russell 2000 and 1000 Percent of Companies by Number of Product Lines
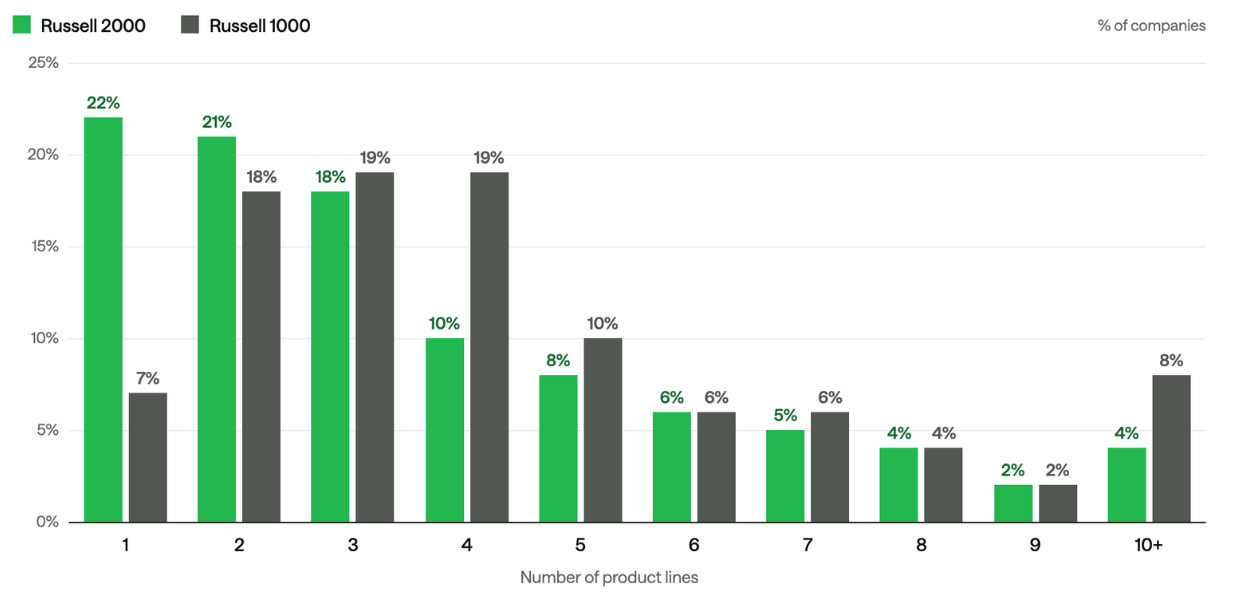
The higher concentration of single product line companies in the Russell 2000, shown in Exhibit 3, highlights several fundamental characteristics of small-cap stocks that investors may underestimate. Smaller companies tend to grow organically rather than through acquisition, a dynamic that also makes them attractive takeover targets for larger firms seeking concentrated, bolt-on growth. The Russell 2000 companies also contains a significantly higher revenue concentration in core product lines, in contrast to the diversified, multi-segment structures typical of many large-cap companies. Exhibit 4 reinforces this point: 71% of the companies in the index generates 50% or more of their revenue from a single product line, and nearly half (48%) of the companies in the index derive 70% or more of their revenue from that same primary product line segment.
Exhibit 4: Percent of Companies in Russell 2000 by Percent of Revenue Generated by Largest Product Line
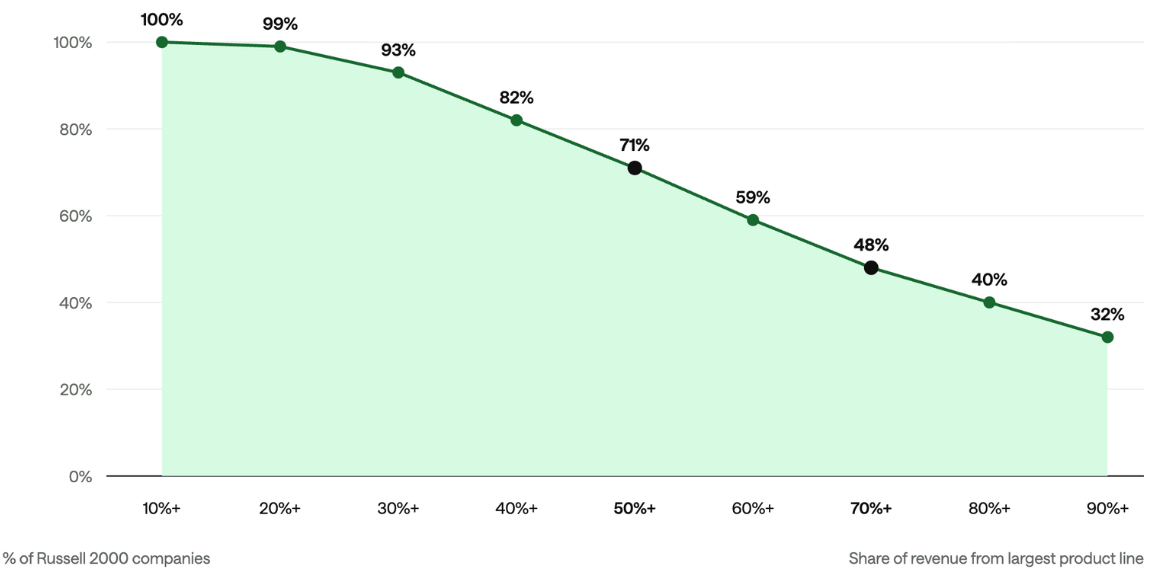
The concentration of revenue around a single product line is more than a structural footnote; it makes the Russell 2000 a fundamentally different kind of investment exposure than the Russell 1000. Where many large-cap companies derive strength from diversified revenue streams and global scale, small-cap companies draw theirs from depth and focus. That distinction shapes not only how these companies behave, but how they complement large-cap exposure within a portfolio. The sections that follow examine where those complementary characteristics are most pronounced.
Russell 2000 vs. Russell 1000: A Complementary Opportunity Set
To identify where small-cap exposure diverges most from large-cap, we compare the primary sector and sub-sector weights of the Russell 2000 against the Russell 1000.
The differences reflect structural biases embedded in how small-cap companies develop and where they tend to concentrate. Exhibit 5 highlights four Cyclical and Asset-Heavy sectors where the Russell 2000 carries notable overweights.
Exhibit 5: Russell 2000 Overweight to Cyclical and Asset Heavy Sectors
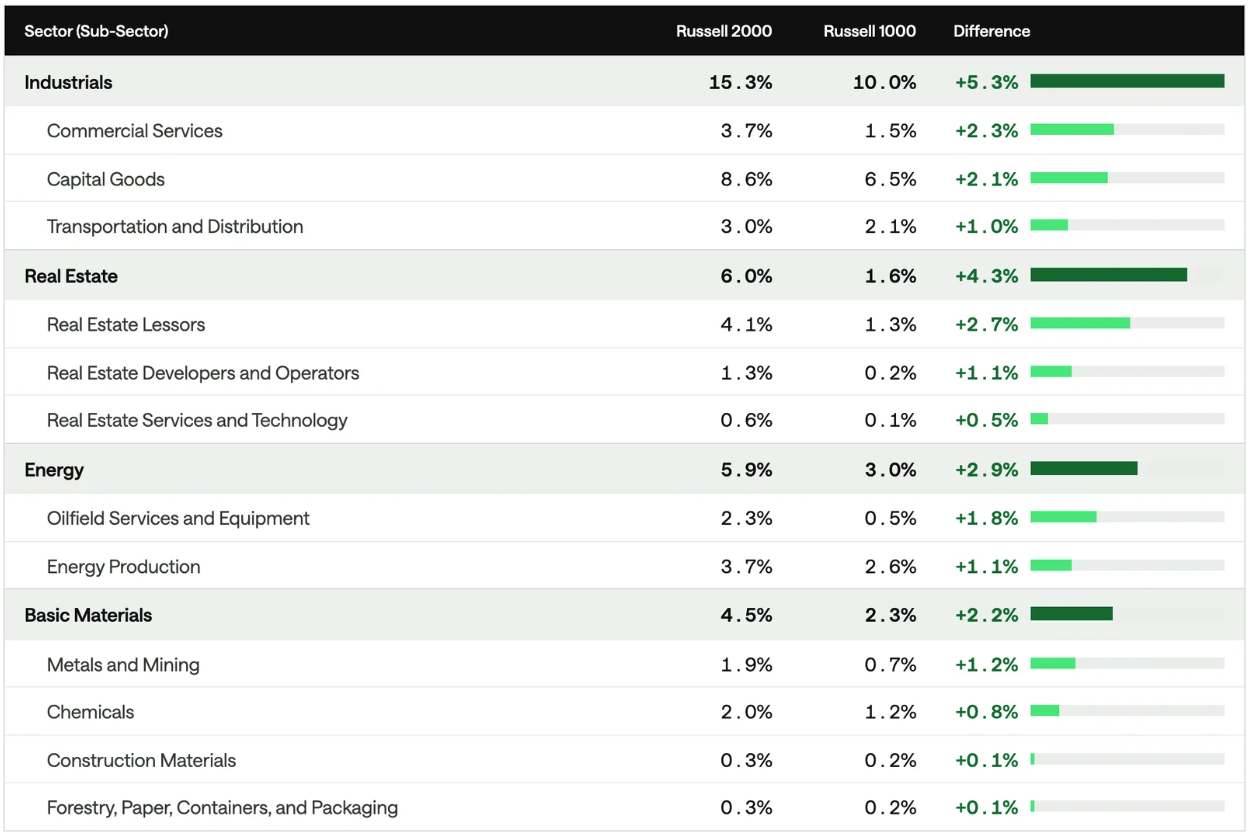
- Industrials (+5.3%): The Commercial Services overweight (+2.3%) is tied to Construction and Engineering businesses. Capital Goods (+2.1%) is the second largest sub-sector overweight. This is a broad category that includes Electrical and Industrial Equipment.
- Real Estate (+4.3%): This is a combination of Real Estate Lessors (REITs) (+2.7%) and Real Estate Developers (+1.1%).
- Energy (+2.9%): Oilfield Services and Equipment (+1.8%) is the primary driver of the sector overweight, with Energy Production (+1.1%) also contributing.
- Basic Materials (+2.2%): The Metals & Mining (+1.2%) sub-sector accounts for over half of this overweight. Chemicals (+0.8%) accounts for most of the remaining overweight.
The Russell 2000's structural overweights are not limited to cyclical and asset-heavy sectors. As Exhibit 6 shows, Healthcare and Financials represent two additional areas of meaningful divergence from the Russell 1000, driven by different dynamics but equally important to understanding the index's risk and return profile.
Exhibit 6: Russell 2000 Overweights to Healthcare and Financials
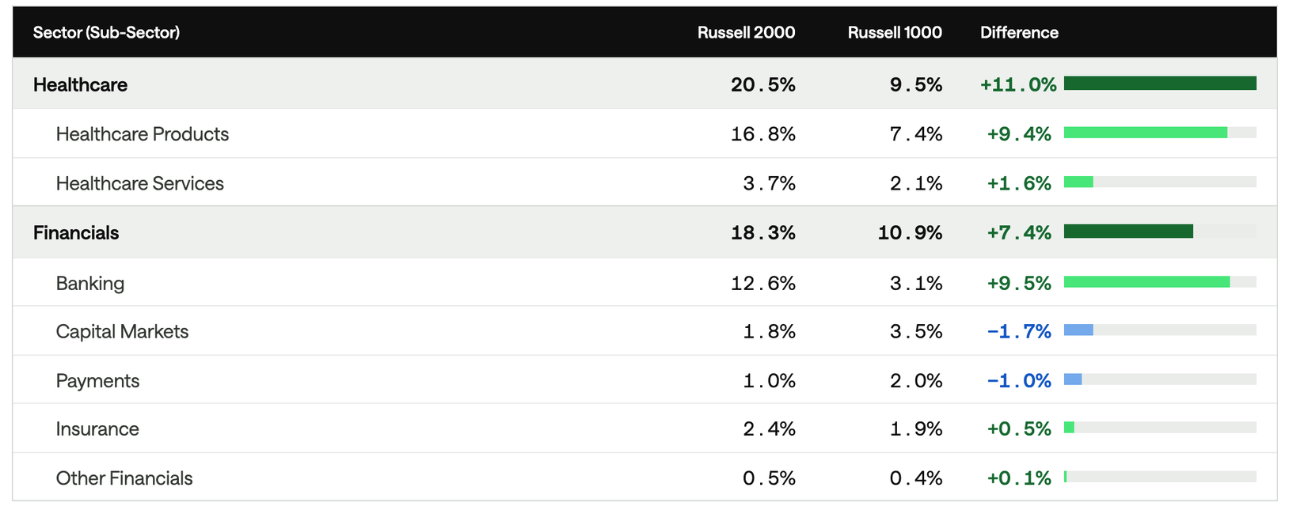
- Healthcare (+11.0%): The Healthcare Products overweight (+9.4%) is driven primarily by pharmaceuticals and biotech companies. Healthcare Services (+1.6%) reflects concentration in outpatient and specialty care providers.
- Financials (+7.4%): Banking (+9.5%) is the dominant overweight, driven primarily by Real Estate Lending, partially offset by underweights in Capital Markets (-1.7%) and Payments (-1.0%).
Due to its structural focus on domestic and cyclical industries, the Russell 2000 is underweight relative to the Russell 1000 in the scalable, global, tech-driven sectors that have led large-cap returns for the past decade. The sector breakdown in Exhibit 7 illustrates the large underweights to the Technology and Communications sectors, highlighting both the Russell 1000's reliance on a narrow set of high-growth sectors and the complementary nature of small-cap business models within a diversified portfolio. There are also more modest underweights to both Consumer Staples and Consumer Discretionary, areas of the public equity market that include large corporations with national and often global scale.
Exhibit 7: Russell 2000 Sector Underweights to the Russell 1000
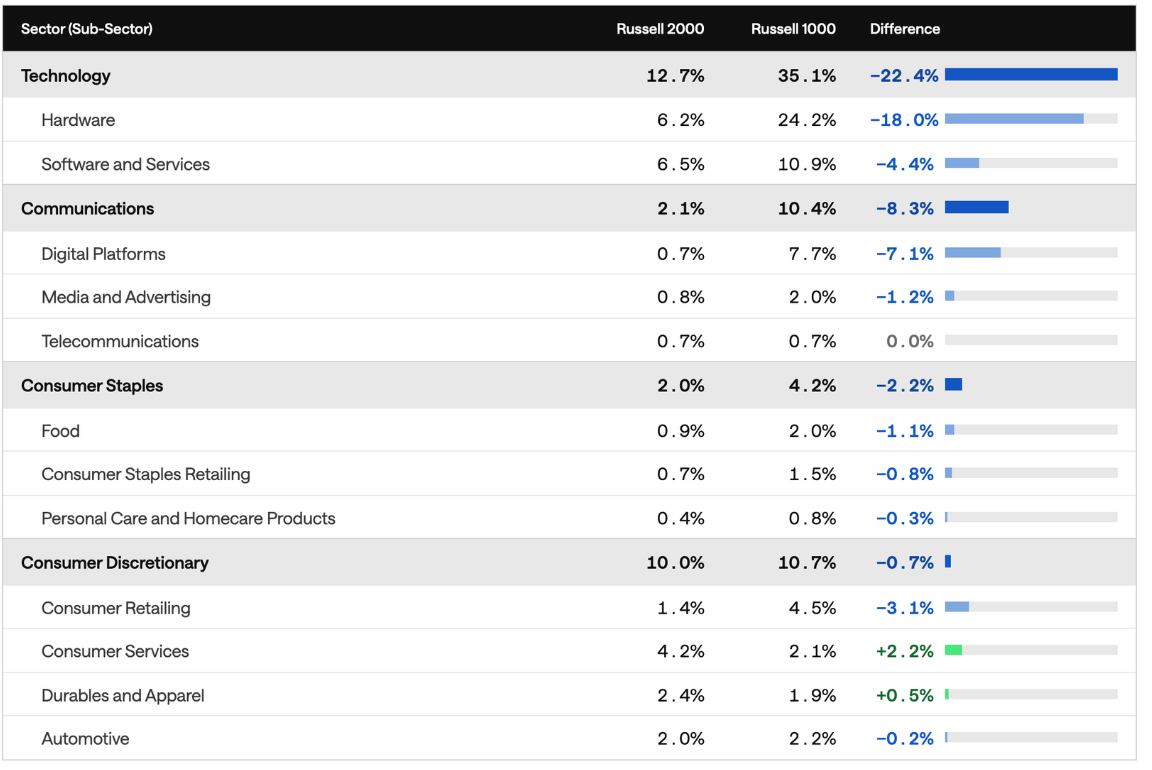
- Technology (-22.4%): The largest absolute underweight is driven by the Russell 1000’s allocation to the Hardware subsector (-18.0%) and exposure to Nvidia's semiconductors and Apple's iPhone businesses. The Software and Services underweight (-4.4%) reflects the Russell 1000’s large positions in Microsoft, Alphabet, and Amazon's cloud and AI platforms, as well as Broadcom's semiconductor infrastructure.
- Communications (-8.3%): This underweight is driven primarily by the Digital Platforms subsector (-7.1%), which includes the Russell 1000's large positions in search (Alphabet, Microsoft), social media (Meta Platforms), and ride-sharing and app platforms (Uber, Apple, Alphabet). Note that Alphabet and Apple appear in both the Technology and Communications sector classifications, reflecting their diversified business models.
- Consumer Staples (-2.2%): Distributed across all subsectors, with the largest deltas in Food (-1.1%) and Consumer Staples Retailing (-0.8%), reflecting lower exposure to large packaged food companies and hypermarket retailers.
- Consumer Discretionary (-0.7%): This modest underweight is driven primarily by Consumer Retailing (-3.1%), reflecting the Russell 1000's large exposure to Amazon and other global online and diversified retail platforms. This is partially offset by an overweight to Consumer Services (+2.2%), which includes Education, Home Security, and Fitness businesses.
The sector divergences documented above translate into economic themes that complement the Russell 1000 and offer investors diversification benefits.
Domestic Economic Cycle: The Russell 2000's overweights to Industrials and Energy add meaningful sensitivity to U.S. capital expenditure cycles and domestic growth. For investors whose large-cap allocations are dominated by globally oriented technology and consumer platforms, this exposure provides a differentiated return driver, one particularly well-positioned to benefit from government onshoring initiatives driving increased domestic manufacturing and infrastructure investment.
Financial and Credit Sensitivity: The Russell 2000's significant overweight to regional Banking and Real Estate finance is structurally different from the capital markets and payments firms that dominate the Russell 1000 Financials. These balance-sheet-driven lenders are more directly tied to the domestic credit cycle, giving investors exposure to a rate-sensitive segment that tends to respond differently than large-cap financials.
Early-Stage Innovation and Specialized Assets: The Russell 2000's Healthcare overweight, concentrated in pharmaceuticals and biotech, provides access to early stage R&D pipelines largely absent from the Russell 1000. Its niche Technology components and specialized Industrials holdings (fuel cells, drone systems, and similar physical assets) offer access to higher risk breakthrough growth opportunities. Notably, the growth opportunities in the small-cap space differ from the large-cap market, where growth is primarily driven by incumbent tech giants, while small-cap growth often comes the innovative, earlier-stage companies those giants often acquire. The index construction methodology also supports innovation through the quarterly additions of Initial Public Offerings (IPOs). This ensures investors get timely access to newly public companies.
Taken together, the Russell 2000's overweight sectors are complementary to the Russell 1000. Investors holding both gain a more balanced exposure across the domestic economic cycle and early-stage innovation than either index provides on its own.
Reduced Individual Security Risk
The Russell 1000's sector composition increasingly reflects a decade-long concentration of market capitalization into a narrow group of mega-cap technology and platform companies. This has left investors exposed to asymmetric downside if high expectations for future growth go unmet and valuations revert to historical norms. Furthermore, this trend shows no signs of slowing — the recent SpaceX IPO and a growing pipeline of highly valued private companies (Anthropic, OpenAI, Anduril, Databricks) weighing potential IPOs suggest further concentration risk ahead. In contrast, the Russell 2000 offers a markedly different structural profile. As Exhibit 8 demonstrates, its top ten holdings, which reflect the recent reconstitution, account for just 3.4% of the total index weight.
Exhibit 8: Top Ten Russell 2000 Companies
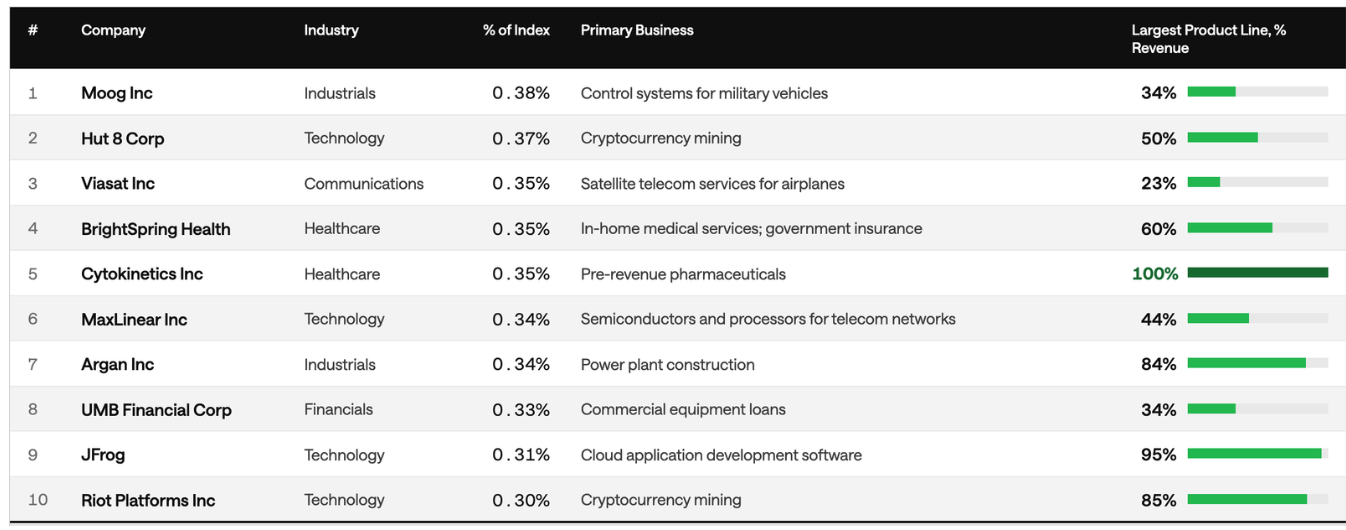
Interestingly, while Technology is the fourth largest sector in the Russell 2000 at 12%, four of the index's ten largest companies are in this sector. These names also represent diverse technology-related exposures: crypto mining, fabless semiconductors, and enterprise DevOps software. There is also a government related theme here as well as four of the companies have government and regulated revenue dependence: Moog (defense platforms), Brightspring (Medicaid/Medicare-funded home care), Viasat (large government/defense satellite segment), and Argan (utility-regulated customers) all rely heavily on government spending or reimbursement. It is worth noting that the Russell 2000 just reconstituted in June, and these top ten companies represent a small portion of the index. That said, these holdings do provide insights into the types of stocks and themes that presently have momentum.
Conclusion
The case for small-cap allocations has often been made on valuation grounds or historical return cycle arguments alone. This analysis suggests an additional, durable rationale. When the Russell 2000 is examined through Syntax's FIS® classification system, what emerges is a structurally distinct set of business exposures that large-cap investors do not otherwise hold.
The Russell 2000's pure-play profile, its concentration in domestically oriented and asset-intensive industries, and its access to early-stage innovation collectively address gaps that have grown more pronounced as the Russell 1000 has become increasingly dominated by a narrow group of global technology platforms. For RIAs and institutional investors constructing diversified portfolios, the complementary nature of these underlying businesses makes a compelling case for a small-cap allocation, one that holds regardless of where small-cap stocks sit in their performance cycle relative to large-caps. That argument only strengthens as large-cap concentration risk continues to expand.
To learn more about Syntax and how FIS® can be applied to index and portfolio analysis, please contact sgrieco@syntaxdata.com or visit syntaxdata.com.