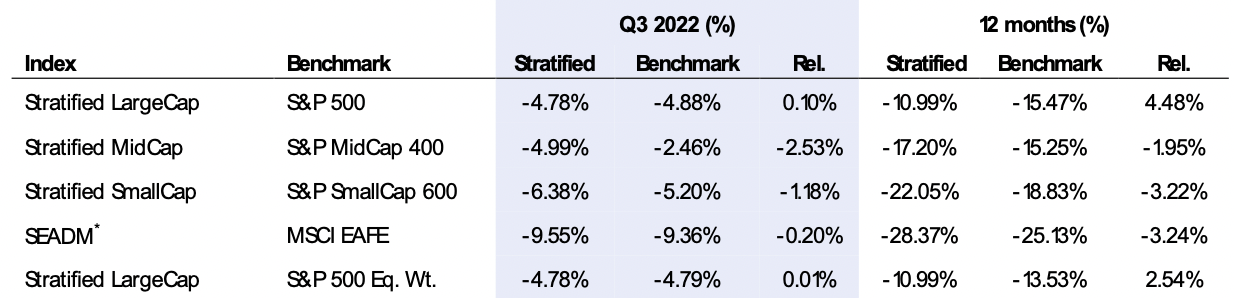
The S&P 500 completed its third quarterly loss this year, by falling 4.88% in Q3 – the benchmark’s longest run of quarterly declines since the Financial Crisis. Rising rates and high valuations were the likely culprits and with inflationary concerns lingering, the macro picture remains challenging.
Amidst this backdrop, the Stratified LargeCap Index returned -4.78% for the quarter, outperforming the S&P 500 by 10bps and performing in-line with the equally weighted index (Exhibit 1). The Stratified MidCap and SmallCap Indices underperformed their cap weighted counterparts in Q3, due to the relatively low growth exposure of the smaller cap-weighted indices. The Stratified Europe Asia Developed Markets (SEADM) Index marginally underperformed the MSCI EAFE Index (by 20bps) due to its larger weight in technology stocks.
Exhibit 1. Core Index Comparison
Source: Syntax, S&P Dow Jones Indices, MSCI. Total return performance does not reflect fees or implementation costs as an investor cannot directly invest in an index. Performance as on 9.30.2022. * Syntax Stratified Europe & Asia Developed Markets Index, based on the MSCI EAFE universe.
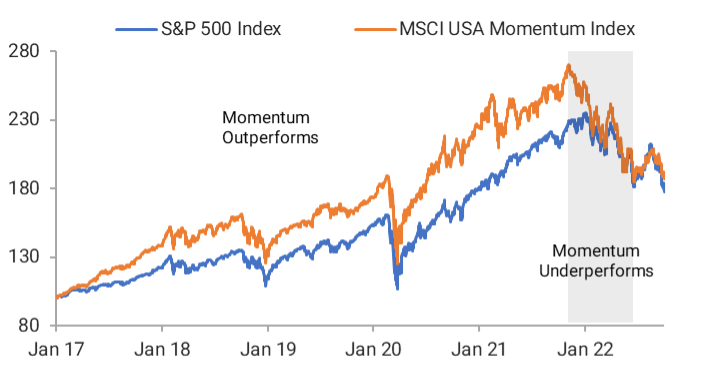
Momentum investing enters a new paradigm
Following a lackluster 2021, momentum investing, the strategy of buying winners and selling losers, struggled again in the first half of this year. As investors shunned growth stocks, mega cap tech stocks, the once darlings of the S&P 500 persistently underperformed the broad market, and so too did momentum indices. The MSCI USA Momentum Factor Index was down 24.0% in the first half of 2022, underperforming the S&P 500 Equal Weight index by 7.4% over the period.
Exhibit 2: US Momentum stocks have started to outperform
Source: Syntax Affinity™. As of 9.30.2022.
However, in August, as new themes became more established, momentum strategies have started to work again (Exhibit 2).
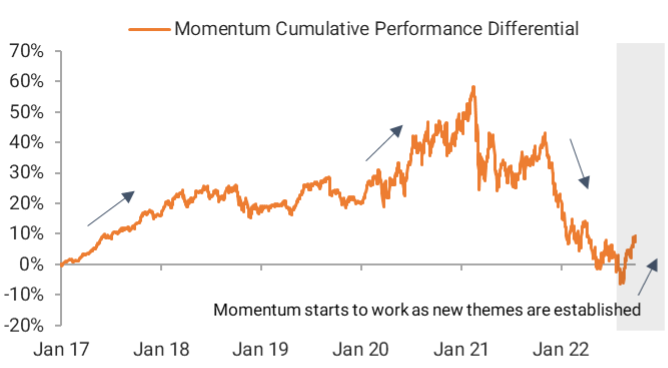
Exhibit 3: US Momentum stocks have started to outperform Source: Syntax Affinity™. As of 9.30.2022.
The classic momentum investing approach involves buying stocks with the strongest 12-month performance (excluding the most recent month’s performance). The strategy relies on the persistence of the trends established over the previous 12 months. Since August, this simple approach has outperformed the S&P 500 Equal Weight Index by 7.5%.
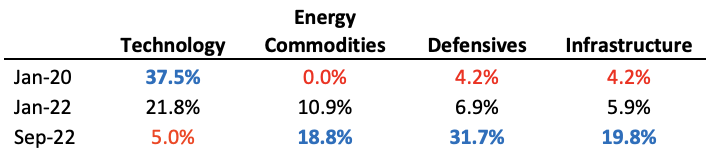
The sectors and themes that are driving this performance are drastically different from those which drove performance during the Pandemic. We used Affinity™ to analyze the thematic trends which are now driving the new momentum paradigm (Exhibit 4).
Exhibit 4: Key thematic exposure within the US Large Cap Momentum basket Source: Syntax Affinity™. As of 9.30.2022.
Before the Pandemic, Tech had already become the dominant theme in the US Large Cap momentum index, making up 37.5% of the index in January 2020. As more investors bought into the tech theme and joined the herd, the trend became self-fulfilling and eventually it became expensive and over-owned. As the market sold off this year, investors rushed to sell their tech holdings and a crowded exit occurred, causing the theme to underperform significantly (-23.9% YoY for the average tech stock, versus 13.5% for the S&P 500 Equal Weighted Index, see Exhibit 7). It currently makes up only 5% of the basic momentum strategy.
The inflation-fueled sell-off this year has seen the outperformance of energy commodity companies and defensives, together with infrastructure stocks. These three themes are all well represented in momentum portfolios. Furthermore, as the momentum factor is once again adding to outperformance, investors may take notice and the new trends could be reinforced.
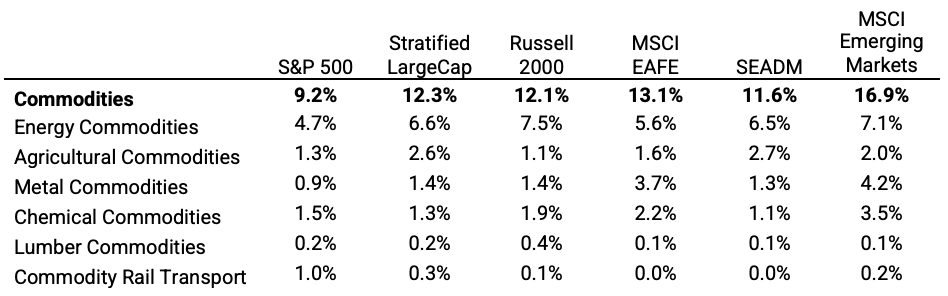
Know What You Own™: Direct Commodity Exposure
One of the most pervasive themes this year, dominating headlines globally, has been higher than expected inflation. As one may expect, commodity groups typically benefit the most from commodity price inflation.
Given the dominance of this theme this year, we highlight that the commodity exposure of different broad equity benchmarks can vary considerably across region, weighting methodology and size segment. It is therefore important to “Know What You Own” and, in this market environment, view the core benchmark exposure through a commodity-specific lens (Exhibit 5).
Exhibit 5: Commodities exposure by broad index
Source: Syntax Affinity™. As of 9.30.2022.
Since cap weighting the US LargeCap market assigns a disproportionately large amount of its weight to Technology companies (37.5%), other segments such as commodity stocks are underrepresented (9.2%). Stratified weighting the same universe suggests that a more neutral stance towards commodity stocks is around 12.5%.
Emerging Markets is the most commodity focused region, with 16.9% of direct commodity exposure. All the major commodity types are well represented, including oil, metals, chemicals and agriculture. As discount rates stabilize, EM stands to be a key beneficiary of high commodity prices.
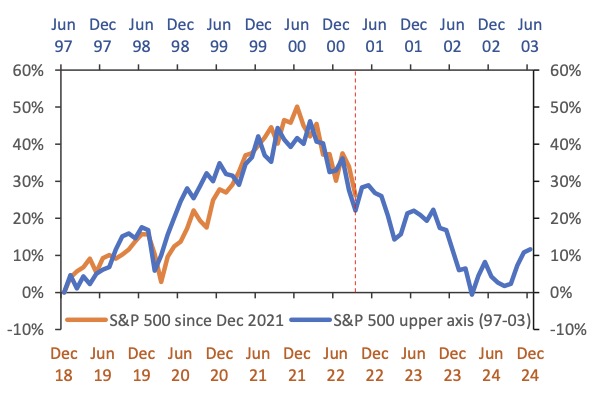
The market continues to follow the 2000 roadmap
As we wrote last quarter, the growth fueled rise and value driven fall of US equity markets over the past five years is uncannily similar to the trading dynamics seen during the building and bursting of the DotCom bubble. The similarities continued in Q3, including the dead-cat bounce in July and fear driven sell-off in August and September 2022 mirroring the performance in Q4 2000. The last quarter of market performance mirrored that seen in Q1 2001 (Exhibit 6).
Exhibit 6: DotCom market unwind compared with current sell-off
Source: Syntax, S&P Dow Jones Indices.
The lesson from the 2000 episode is that even though growth stocks had underperformed significantly by the end of 2000, their still high valuations coupled with their oversized weight within the cap weighted indices, meant that they had plenty of room to fall further as investors capitulated. Indeed, Momentum strategies outperformed the broad index by almost 30% in the 18 months following Q1 2001.
With the Nasdaq trading at almost twice the earnings multiple of the S&P 500 and technology still 37.5% of the broad index, the recent trend has plenty of fuel to persist.
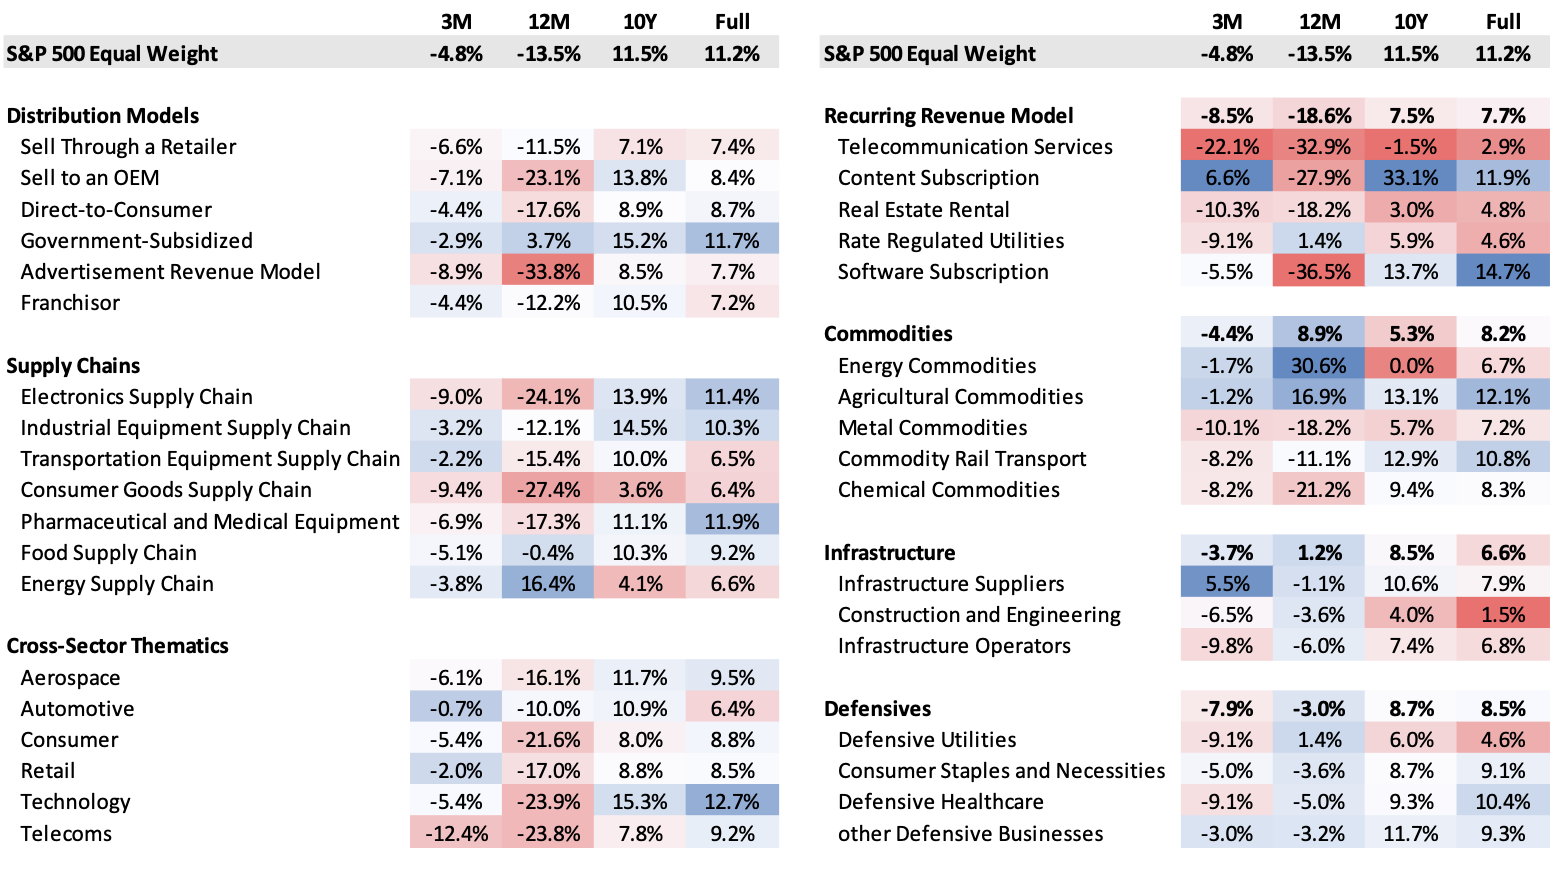
Exhibit 7. Thematic Performance and Exposure within the US LargeCap universe
Source: Syntax, Affinity, S&P Dow Jones Indices. Performance is calculated as the weighted average total return of the subset of the S&P 500 Equal Weight Index constituents who are members of the Affinity Theme. QoQ shows total return for 6.30.22 to 9.30.22. YoY shows total return from 9.30.21 to 9.30.22. Full performance period uses period from 12.31.1991 when available. Performance does not reflect fees or implementation costs.