

The DF Risk-Managed Tactical Top 30 Index
Key Takeaways
- Studies have shown that momentum strategies have earned a market risk premium over time in the US public equity markets but can struggle and underperform in prolonged bear markets.
- The DF Risk-Managed Tactical Top 30 Index seeks to realize the potential benefits of a momentum strategy while mitigating the downside risk of long bear markets by using a tactical overlay that can move the index to treasuries when return trends turn bearish.
- The stock selection component of the strategy is a focused momentum approach where the index holds the 30 stocks with the highest price momentum score from a universe of 100 US mega cap stocks.
- The index rebalances quarterly, dynamically shifting allocations to sectors containing the most momentum-driven stocks.
Overview
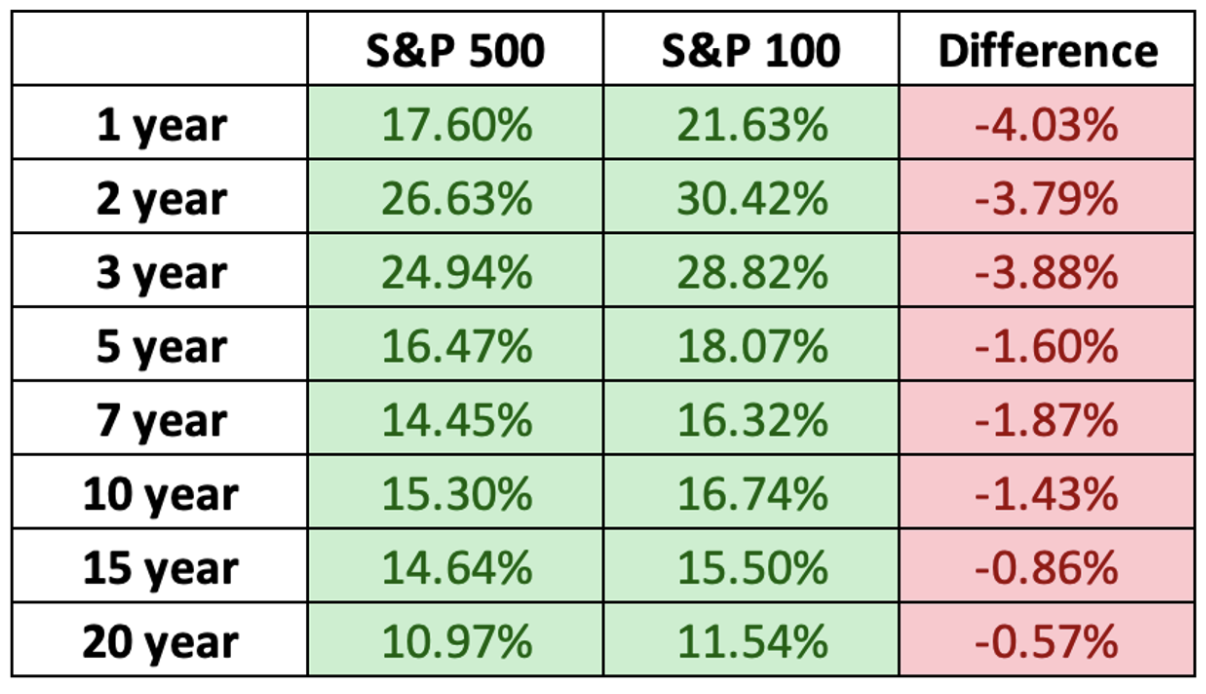
The S&P 500 Index is notoriously hard to outperform.1 However, there is a simple approach that has generated outperformance across many investment horizons. The strategy is to focus on the 100 largest companies, as represented by the S&P 100 Index. This index has outperformed the S&P 500 in the trailing 1, 2, 3, 5, 7, 10, 15, and 20 years ending 9/30/2025, as shown in Exhibit 1. Moreover, this outperformance has accelerated in recent years, driven by stellar returns from names like Nvidia, Broadcom, and Palantir.
Exhibit 1: S&P 500 vs. S&P 100
The megacap universe therefore provides a strong foundation from which to apply more sophisticated techniques designed to further augment performance, such as momentum and tactical overlays.
Momentum as an investment strategy centers around buying stocks with an upward price trend and selling them once signals indicate that they may have peaked. A review of the academic research on momentum produced the following three observations:
Momentum as an investment strategy centers around buying stocks with an upward price trend and selling them once signals indicate that they may have peaked. A review of the academic research on momentum produced the following three observations:
- Momentum has earned a market risk premium over time in the US public equity markets.
- Momentum strategies struggle and underperform in long-bear markets such as the 1930's and 2000's.
- A dynamically hedged momentum strategy can outperform an unhedged strategy.
In this paper, we highlight two indices designed in collaboration between Donoghue Forlines and Syntax Data that offer an innovative, risk-managed approach to momentum exposure:
- The DF Tactical Top 30 Index: an equity index of 30 US mega cap stocks that holds companies exhibiting strong momentum characteristics.
- The DF Risk-Managed Tactical Top 30 Index: the DF Tactical Top 30 Index with a tactical overlay that can move the index to 100% treasuries in certain bearish environments.
For the balance of the paper, the indices are referred to as the DF Top 30 and DF Risk-Managed Top 30 indices. Both were constructed and are calculated and maintained by Syntax Data.
The backtested performance for both indices is discussed in detail in this paper, highlighting their modeled outperformance relative to the Syntax MegaCap 100 Index (SY100) – a market capitalization-weighted measure of US large cap companies comparable to the S&P 100 Index. Prior to analyzing the backtested performance, we first provide a review of academic research supporting momentum-based strategies and the use of a tactical overlay. We then move into a discussion on security selection and how this impacts sector exposure and exposure to the Magnificent Seven over time.
The History of Momentum
The history of momentum from an investment research perspective dates back to 1993 when the Journal of Finance published a study by Narasimhan Jegadeesh and Sheridan Titman in which they concluded:
“Strategies of buying recent stock winners and selling recent losers generated significantly higher near-term returns than the U.S. market overall from 1965 to 1989…a stock’s relative performance over the previous three to 12 months typically predicted its relative performance for the following three to 12 months.”2
More recent research has pointed to a similar conclusion. In their September 2014 paper titled Fact, Fiction, and Momentum Investing, Clifford S. Asness, Andrea Frazzini, Ronen Israel, and Tobias J. Moskowitz noted:
“Momentum is the phenomenon that securities which have performed well relative to peers (winners) on average continue to outperform, and securities that have performed relatively poorly (losers) tend to continue to underperform. The existence of momentum is a well-established empirical fact.”3
The research also pointed out that momentum, like any investment strategy, does not work all the time. In research that confirmed the presence of momentum in the US public equity market from 1801 to 2012, Christopher Geczy and Mikhail Samonov noted that momentum strategies fail in volatile, long-lasting bear markets such as those that occurred in the 1930s and 2000s. The paper also highlighted the following observation: “A dynamically hedged momentum strategy significantly outperforms the un-hedged strategy.”4 That is, combining momentum strategies and hedging techniques may help investors mitigate the drawdown risk associated with long lasting bear markets, which in turn may support higher risk-adjusted returns.
Momentum Index Construction
Momentum-based strategies come in different flavors. The concept of momentum can be applied to a stock’s earnings or price growth, and stock weighting approaches can range from equal weight to cap weight to more complicated score-based approaches. Some strategies can take a best-in-sector approach, while others may purely target momentum stocks regardless of sector and industry. Either way, sector exposures can be managed or constrained to the weight of a specific benchmark, or the sector exposure can be a fallout of the security selection process. These are important considerations as two momentum strategies may have considerably different risk and return profiles based on methodology applied.
The DF Top 30 Index takes a straightforward approach to momentum investing. Starting from the Syntax MegaCap 100 universe, thirty stocks are selected based on their price momentum score calculated using an exponential moving average (EMA)5. The index is reconstituted quarterly based on the updated scores of its constituents. To determine the weight of each of the individual stocks, the following methodology is applied:
- Stocks are grouped in deciles by price momentum score.
- The stocks in the top three deciles receive an initial weight that matches their weight in the market cap-weighed Syntax MegaCap 100 index.
- The stocks in the bottom seven deciles have their weights reduced to zero.
- The collective weight of the stocks in the bottom seven deciles is then allocated equally to the securities in the top three deciles – i.e., if the weight of the bottom seven deciles is 30%, then the top 30 stocks each have 1% added to their market cap weight in the benchmark.
The DF Risk-Managed Top 30 Index applies a tactical overlay to switch between the DF Top 30 Index when return trends are bullish, and treasuries when return trends are bearish. The overlay utilizes two triggers that calculate the EMA of the Syntax US MegaCap 100 Index over intermediate- and longer-term trends. These calculations are used to create both a bearish and bullish signal to trigger asset allocation changes.
- Bearish trigger: if the longer-term EMA calculation is less than 1, it means intermediate-term returns are trending below longer-term returns, which implies returns are in a deterioration trend. This triggers the index to move the allocation to treasuries, seeking to avoid drawdowns.
- Bullish trigger: if the intermediate-term EMA calculation is greater than 1, it implies that market sentiment has improved, triggering a move to momentum equities.
These signals are calculated daily at the market close and at times may both be bullish, both bearish, or one bullish and one bearish. The decision to move into treasuries is always determined by the bearish signal and the decision to move into equities is driven by the bullish signal. When a change is triggered, the DF Risk-Managed Top 30 Index changes its allocation effective as of the market open two trading days later.
If the tactical overlay points to an equity allocation, the holdings remain in the index until the next quarterly reconstitution when the stocks in the universe are rescored and the index holdings are updated accordingly. Like other momentum strategies, these indices typically have high turnover as they rotate into securities with favorable trends. This may make index implementation relatively inefficient and therefore these indices may be more applicable for tax-efficient vehicles or certain retirement vehicles.
Individual Security and Sector Weights
Before reviewing the backtested performance of the indices, it is important to understand the security selection process and how this impacts sector exposure. A key feature of the DF Top 30 Index is that it leans into the securities with the highest price momentum trend. As such, its exposure to specific sectors rotates based on which stocks are exhibiting the highest price momentum.
Exhibit 2 illustrates how the modeled sector allocation in the Index has evolved since 2013.
Exhibit 2: Modeled Sector Exposure DF Top 30 Index
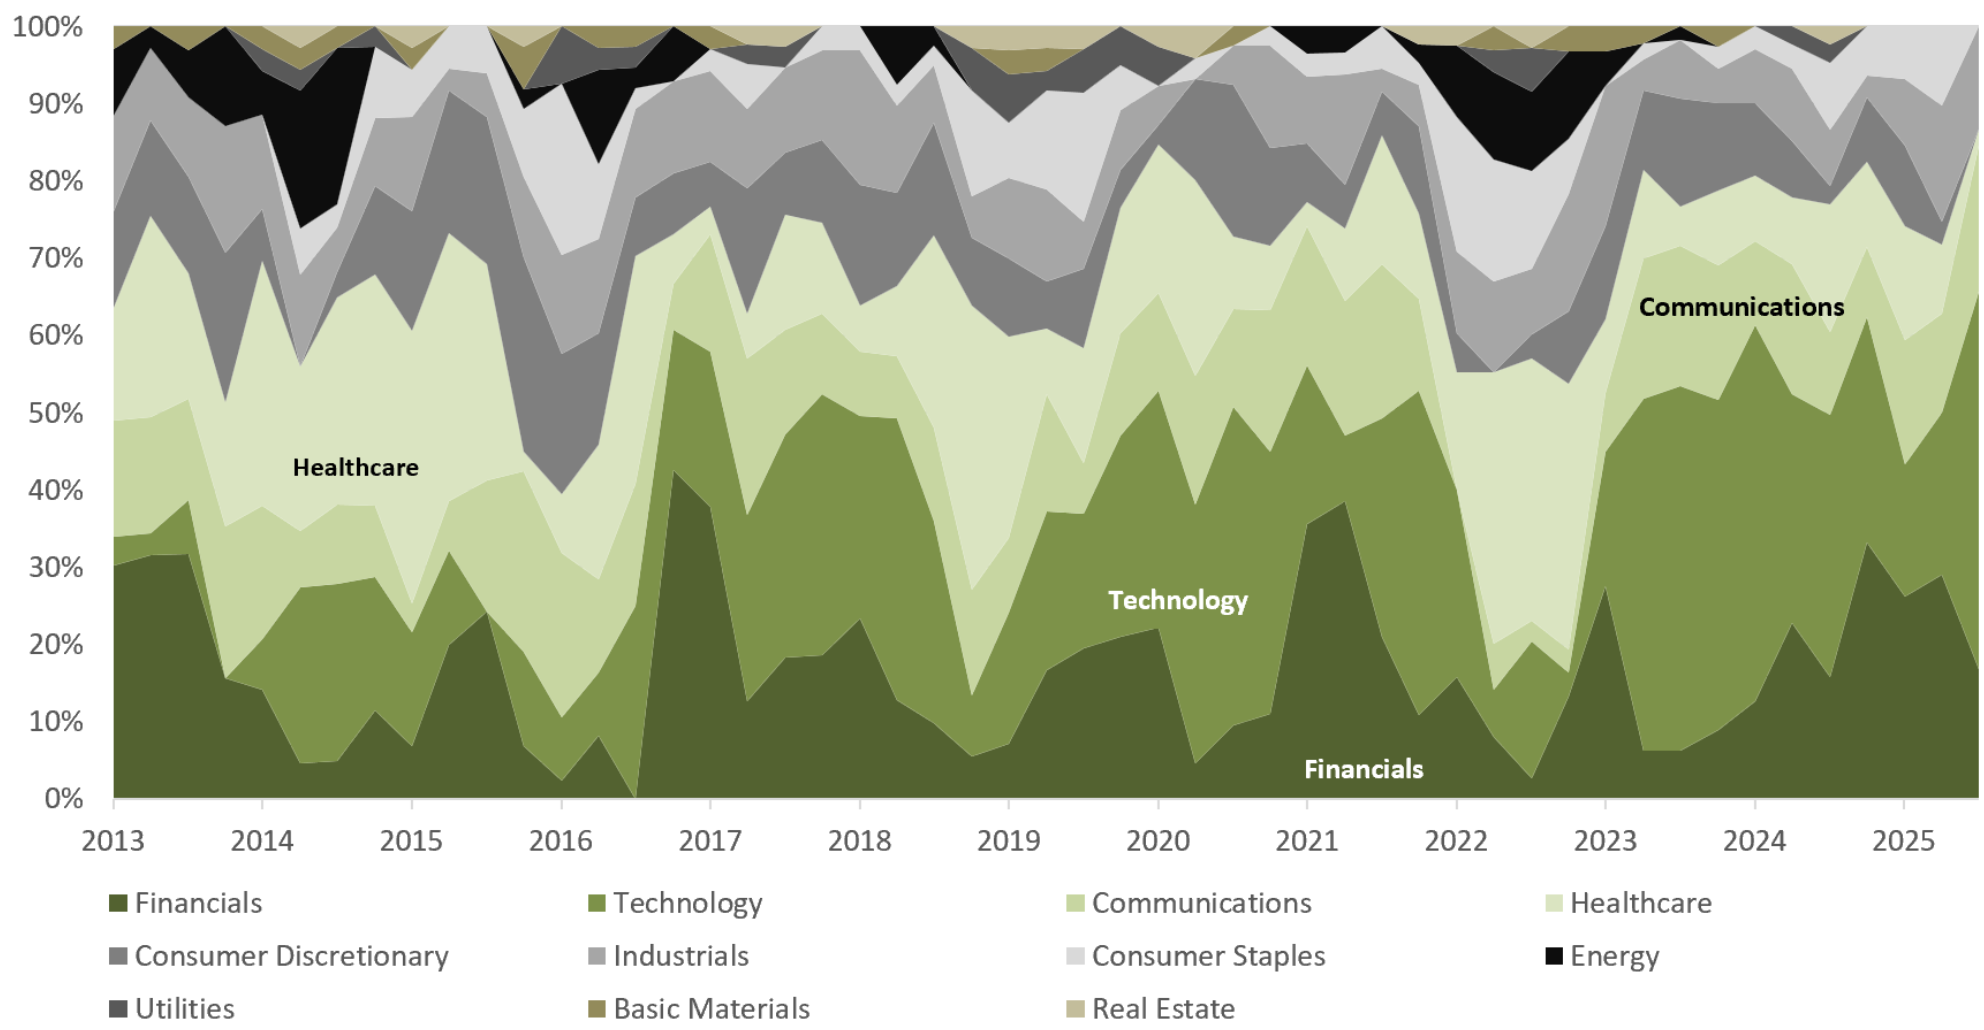
Sector exposures can change quickly as different stocks assume market leadership. Exhibit 2 shows that four sectors (Financials, Technology, Healthcare and Communications) both individually and collectively have made up a large portion of the index over the modeled period, ranging as a group from a low of roughly 40% to a high of about 80%. Exhibit 3 highlights the ranges of each sector’s modeled allocation from March 2013 through September 2025.
Exhibit 3: Modeled Sector Exposure Statistics DF Top 30 Index
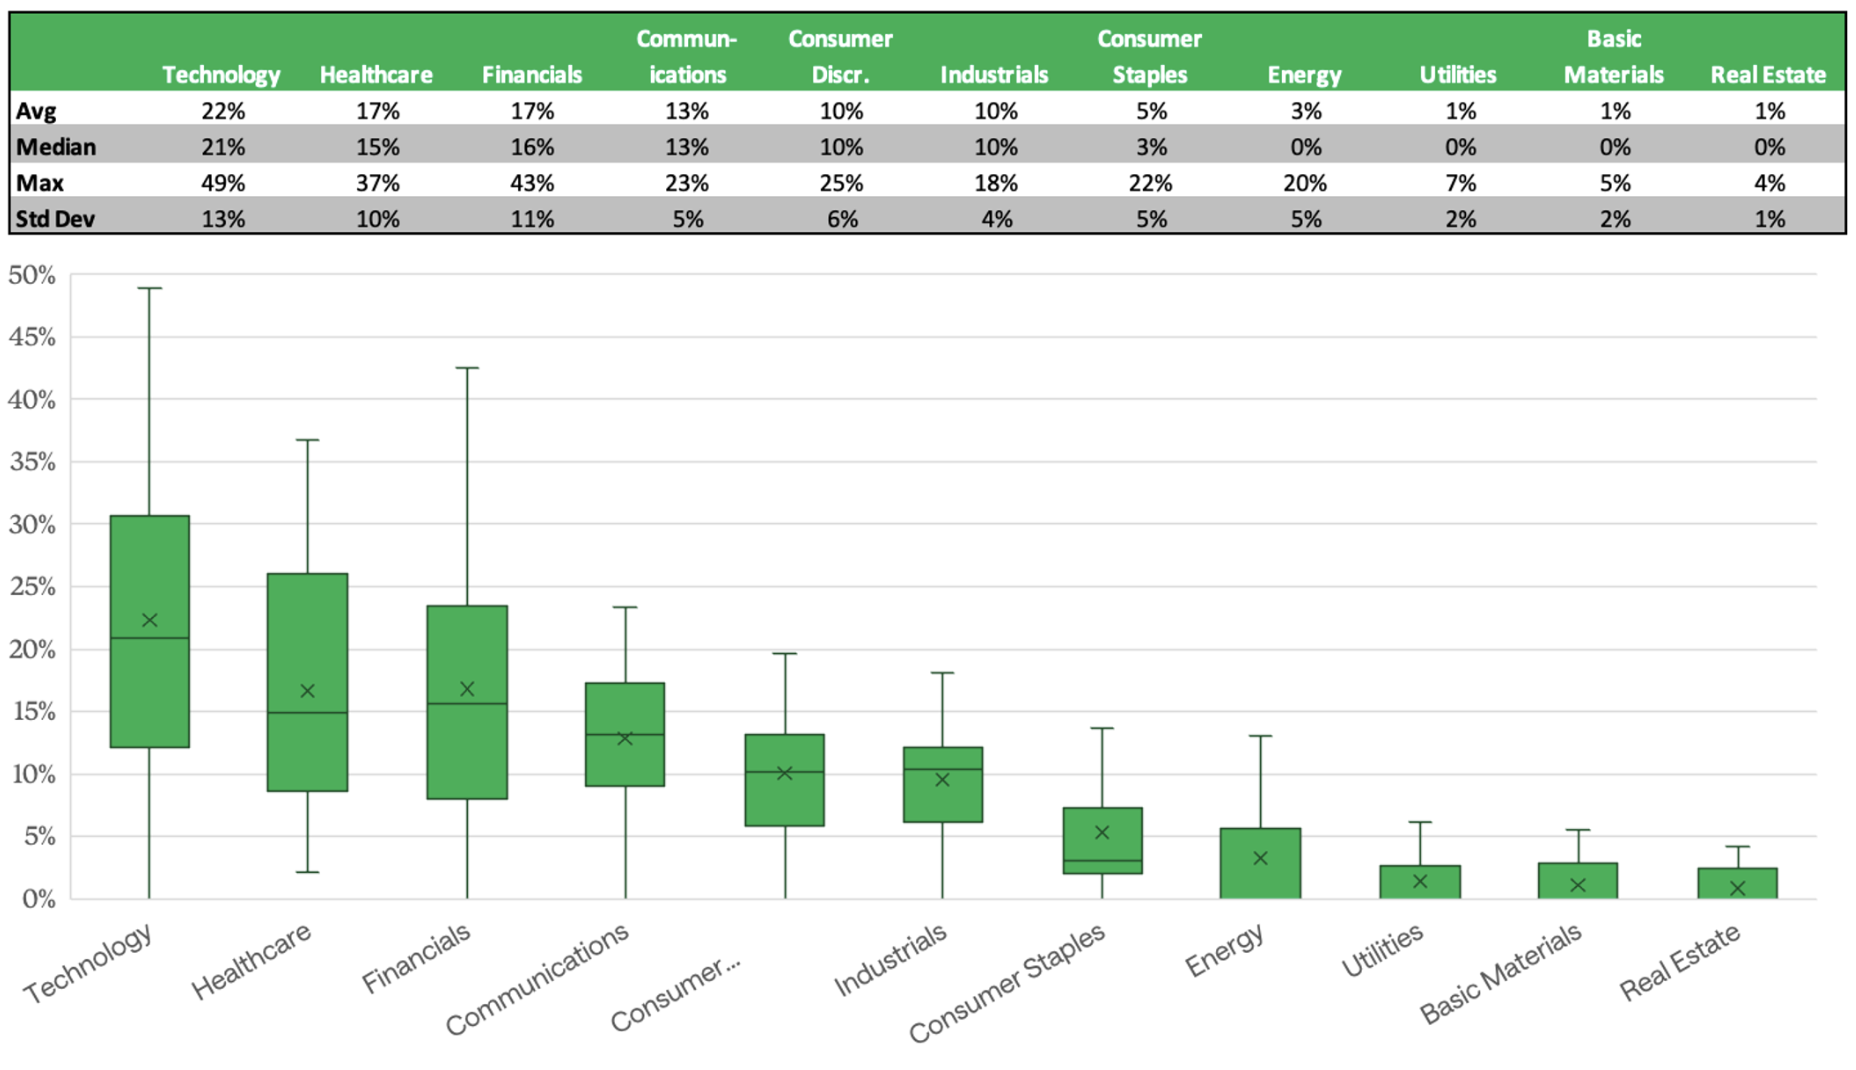
Not surprisingly, Technology had the highest modeled average weight (22%), the highest max (49%), and the largest standard deviation (13%). Healthcare and Financials posted meaningful modeled average and maximum weights, with Communications not far behind. Consumer Discretionary and Industrials averaged 10% weight over the modeled period, and max weights that were 25% and 18%, respectively. The remaining sectors all had modest simulated exposure on average, along with modest maximum index weights, although Energy did receive a 20% weight in the backtest in 2014.
Any discussion of US momentum stocks will likely soon turn to the Magnificent Seven and their role in driving both the US large cap and broad market index results over the past five years. As a point of reference, their collective market cap has grown from $5.2 trillion at the beginning of 2020 to almost $21 trillion as of the end of Q3’25. In Exhibit 4 we highlight the backtested exposure of the Magnificent Seven in the DF Risk Managed Top 30 Index.
Exhibit 4: DF Risk-Managed Top 30 Index Magnificent Seven Exposure
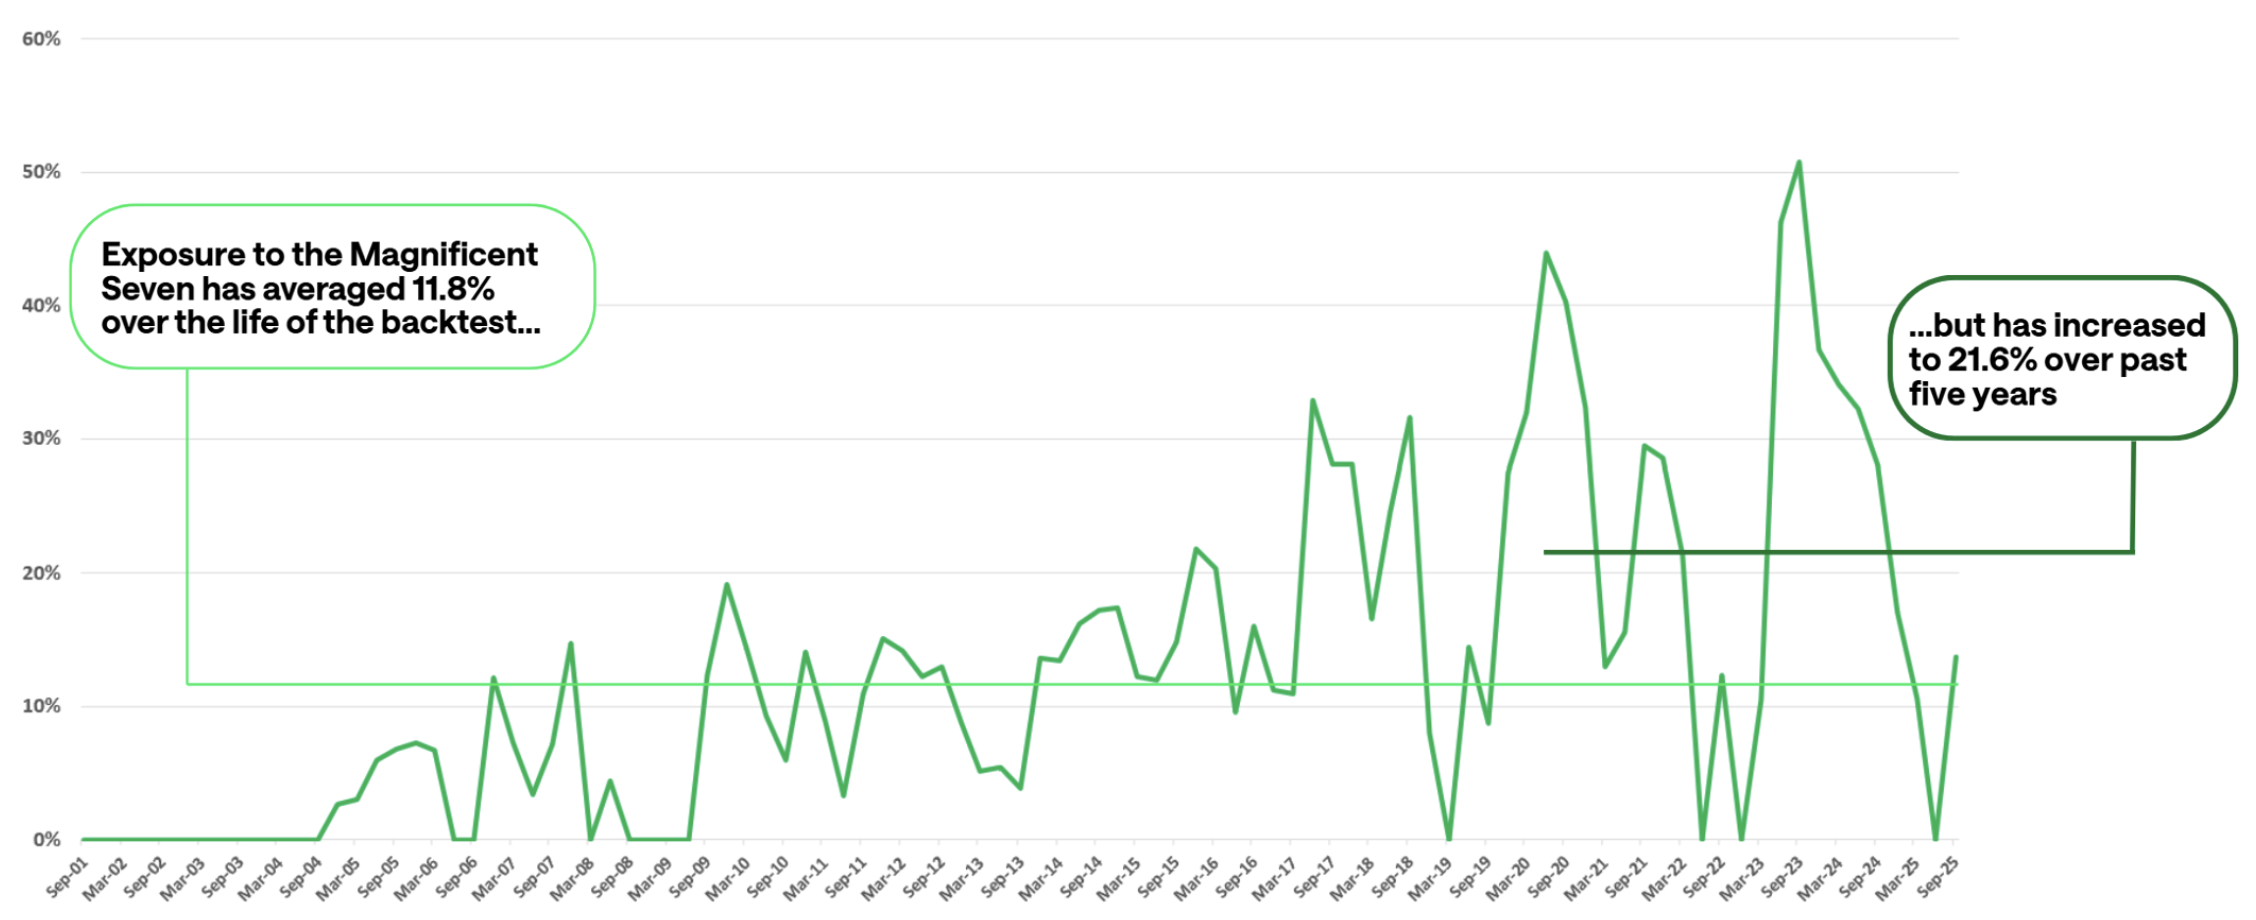
Over the life of the backtest, the average weight to the Magnificent Seven has been about 12% both with and without the tactical overlay.6 More recently, over the past five years, their average modeled weight has been 21.6% in both. The weight of the Magnificent Seven in the Syntax MegaCap 100 at the end of Q3 2025 was 45.9%.
While the weight of the Magnificent Seven has been volatile based on their changing price momentum characteristics, the modeled weight of the top 10 holdings in the DF Top 30 Index has ranged from 37% to 60%, with an average weight of 44% over the backtest as shown in Exhibit 5.
Exhibit 5 DF Top 30 Index: Modeled Weight of Top 10 Holdings

Backtested Performance
To assess the effectiveness of the stock selection process, Syntax simulated a backtest from 7/20/2001 through 4/30/2025 for the DF Top 30 Index and compared the results to the Syntax MegaCap 100 Index. The results are shown in Exhibit 6.
Exhibit 6: Hypothetical Growth of $1 million: DF Top 30 Index vs. Syntax MegaCap 100 and S&P 500 Indices

A hypothetical investment of $1 million in the DF Top 30 Index at the start of the backtest grew to $10.1 million by 9/30/2025, gross of fees and expenses, compared to about $8.9 million for the Syntax MegaCap 100 benchmark – a modeled cumulative outperformance of roughly 12% on a dollar basis. The DF Top 30 Index returned 10.03% annually in the backtest compared to 9.50% for the benchmark, a modeled outperformance of 53 basis points. The results suggest that a momentum-based investment approach may earn a premium over a cap-weighted, market-based index. As a point of reference, the modeled 9.50% return of the Syntax MegaCap Index was comparable to the S&P 500’s 9.37% return over this long period.
To assess the potential effectiveness of the overlay, we compare the results of the DF Risk-Managed Top 30 Index (with overlay) to the DF Top 30 Index (without overlay) and the SY100 and S&P 500 Indices as shown in Exhibit 7.
The results support the value of the overlay over the backtest period. Using a hypothetical $1 million investment, the Risk-Managed Index reaches a modeled ending value of $21.6 million, gross of fees and expenses, which is over 200% higher than both the simulated $10.1 million value for the DF Top 30 Index and the modeled Syntax MegaCap 100 Index value of $8.9 million. On an annualized basis, the DF Risk-Managed Top 30 Index returned 13.54% in the model, 351 basis points above the DF Top 30 Index, and 404 basis points above the SY100.
Exhibit 7: Modeled Growth of $1 million: DF Risk-Managed Top 30 and DF Top 30 Indices vs. Syntax MegaCap 100 and S&P 500 Indices
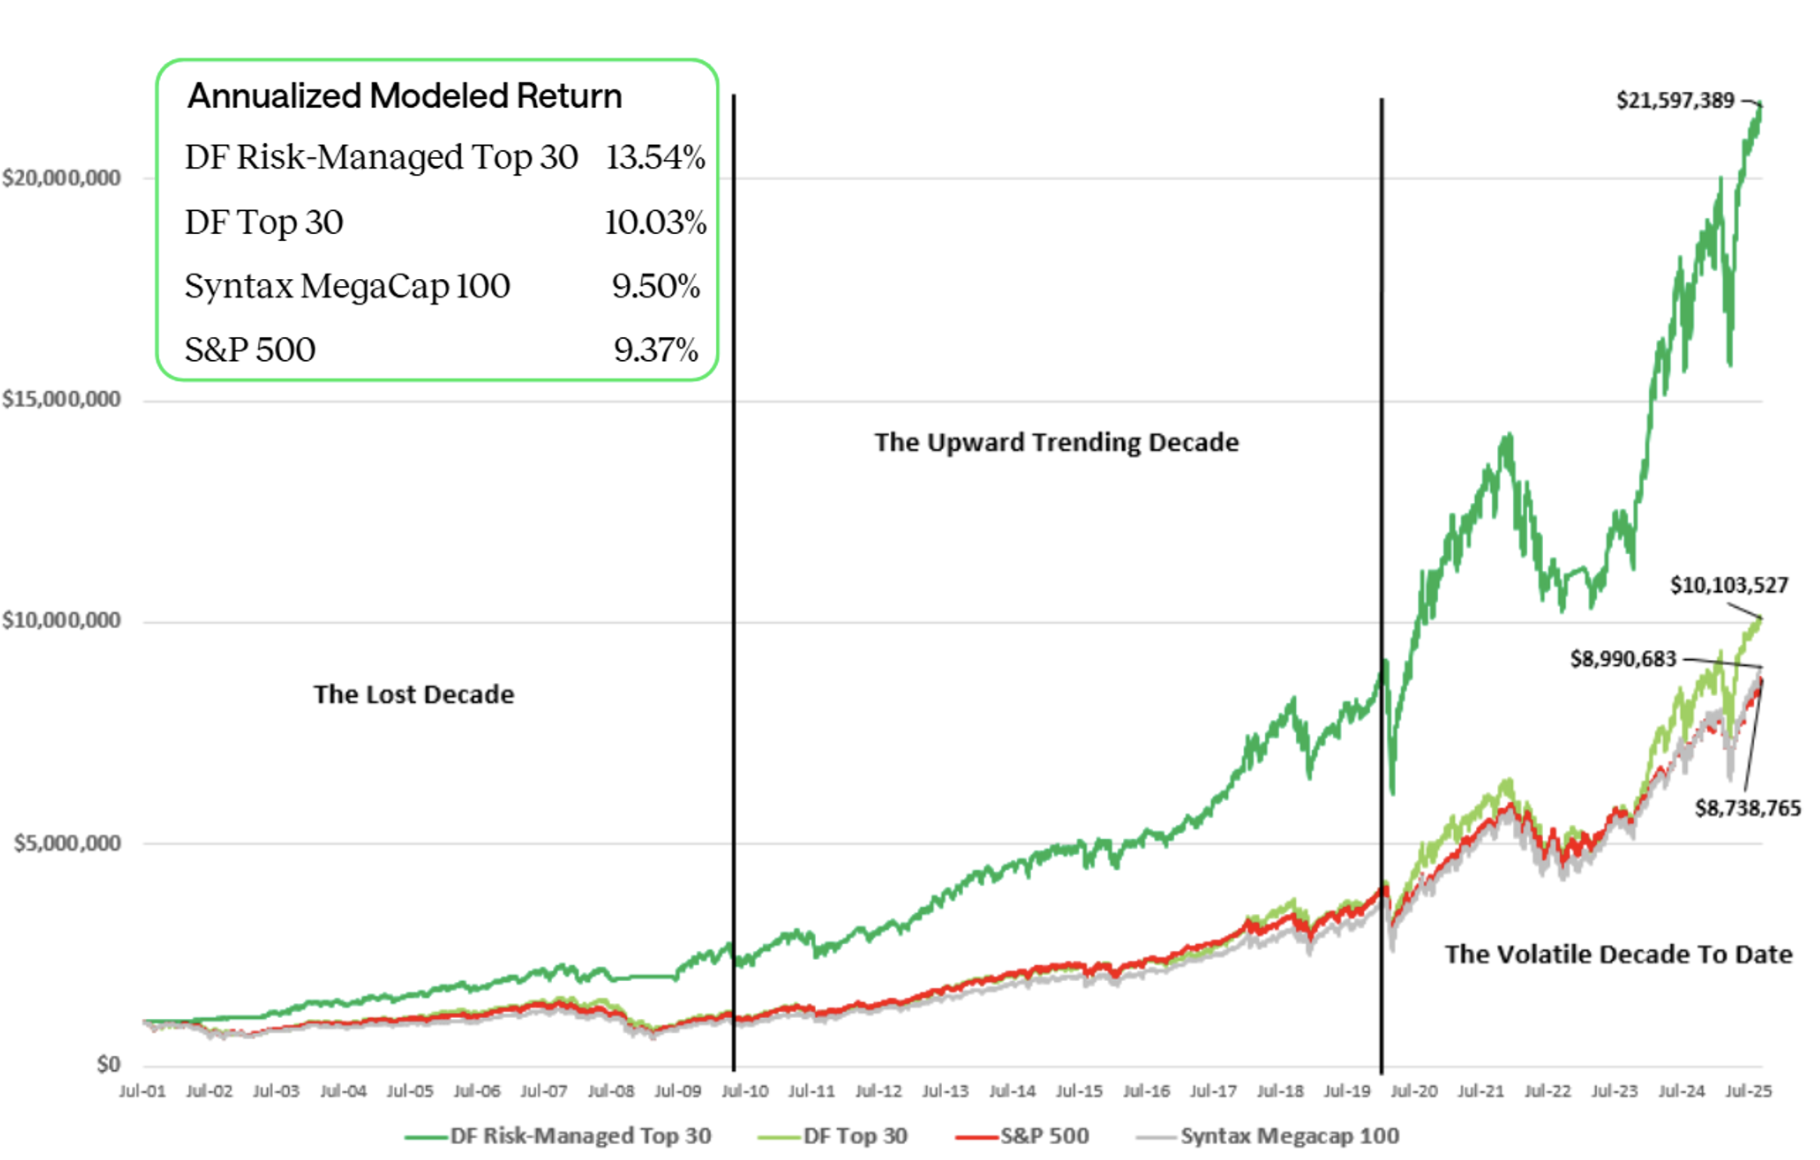
The graph shows performance over three distinct market cycles, defined as 1) the Lost Decade; 2) the Upward Trending Decade; and 3) the Volatile Decade To Date. Below, we analyze performance during each of these market environments to assess the modeled effectiveness of the Top 30 Indices, with and without the risk-managed overlay.
The Lost Decade
The backtest for the Top 30 Indices starts on July 20, 2001, capturing simulated performance for most of the first decade of this century. We titled this time segment “The Lost Decade” as cap-weighted benchmarks like the S&P 500 returned roughly 0% annualized for the 10-year period ending 12/31/2009, representing a unique time where the S&P 500 was a performance laggard relative to domestic small and mid-cap stocks.
Exhibit 8 highlights that in the backtest, a $1 million investment in the Risk-Managed Top 30 Index grew to $2.51 million, outperforming the DF Top 30 Index ($1.14 million) and the Syntax 100 ($0.99 million) by large amounts.
Exhibit 8: Modeled Growth of $1 million: DF Risk-Managed Top 30 and DF Top 30 Indices vs. Syntax MegaCap 100 and S&P 500 Indices: 7/20/2001 to 12/31/2009

- The darker green line represents the Risk-Managed Top 30 Index. The graph is annotated to highlight the impact of the modeled move into the tactical overlay that occurred in both bear markets that defined this decade: the bursting of the Tech Bubble and the Global Financial Crisis. The rules-based trigger to allocate to treasuries in the model provided downside protection and moved back into equities in the model in a timely fashion when the market began its recovery from both events.
- The differences in modeled returns, as noted in the text box in the exhibit, were pronounced. The annualized backtested results of the DF Risk-Managed Top 30 Index was 11.6%, compared to 1.6% for the DF Top 30 Index and -0.1% for the Syntax 100.
- During this period, overall large cap companies outperformed megacap ones by a margin of just over 1% per year.
Upward Trending Decade
The second decade of the century was largely a period of rising markets with generally low volatility. The market did have a few bumps in the road, most notably in Q4 2018, but the overall trend in volatility and returns was consistently positive, so much so that the trigger in the model to move from equities to treasuries was never executed. As a result, in Exhibit 9, the lines for both DF Indices are identical thus appearing as one.
Exhibit 9: Modeled Growth of $1 million: DF Risk-Managed Top 30 and DF Top 30 Indices vs. Syntax MegaCap 100 and S&P 500 Indices: 12/31/2009 to 12/31/2019
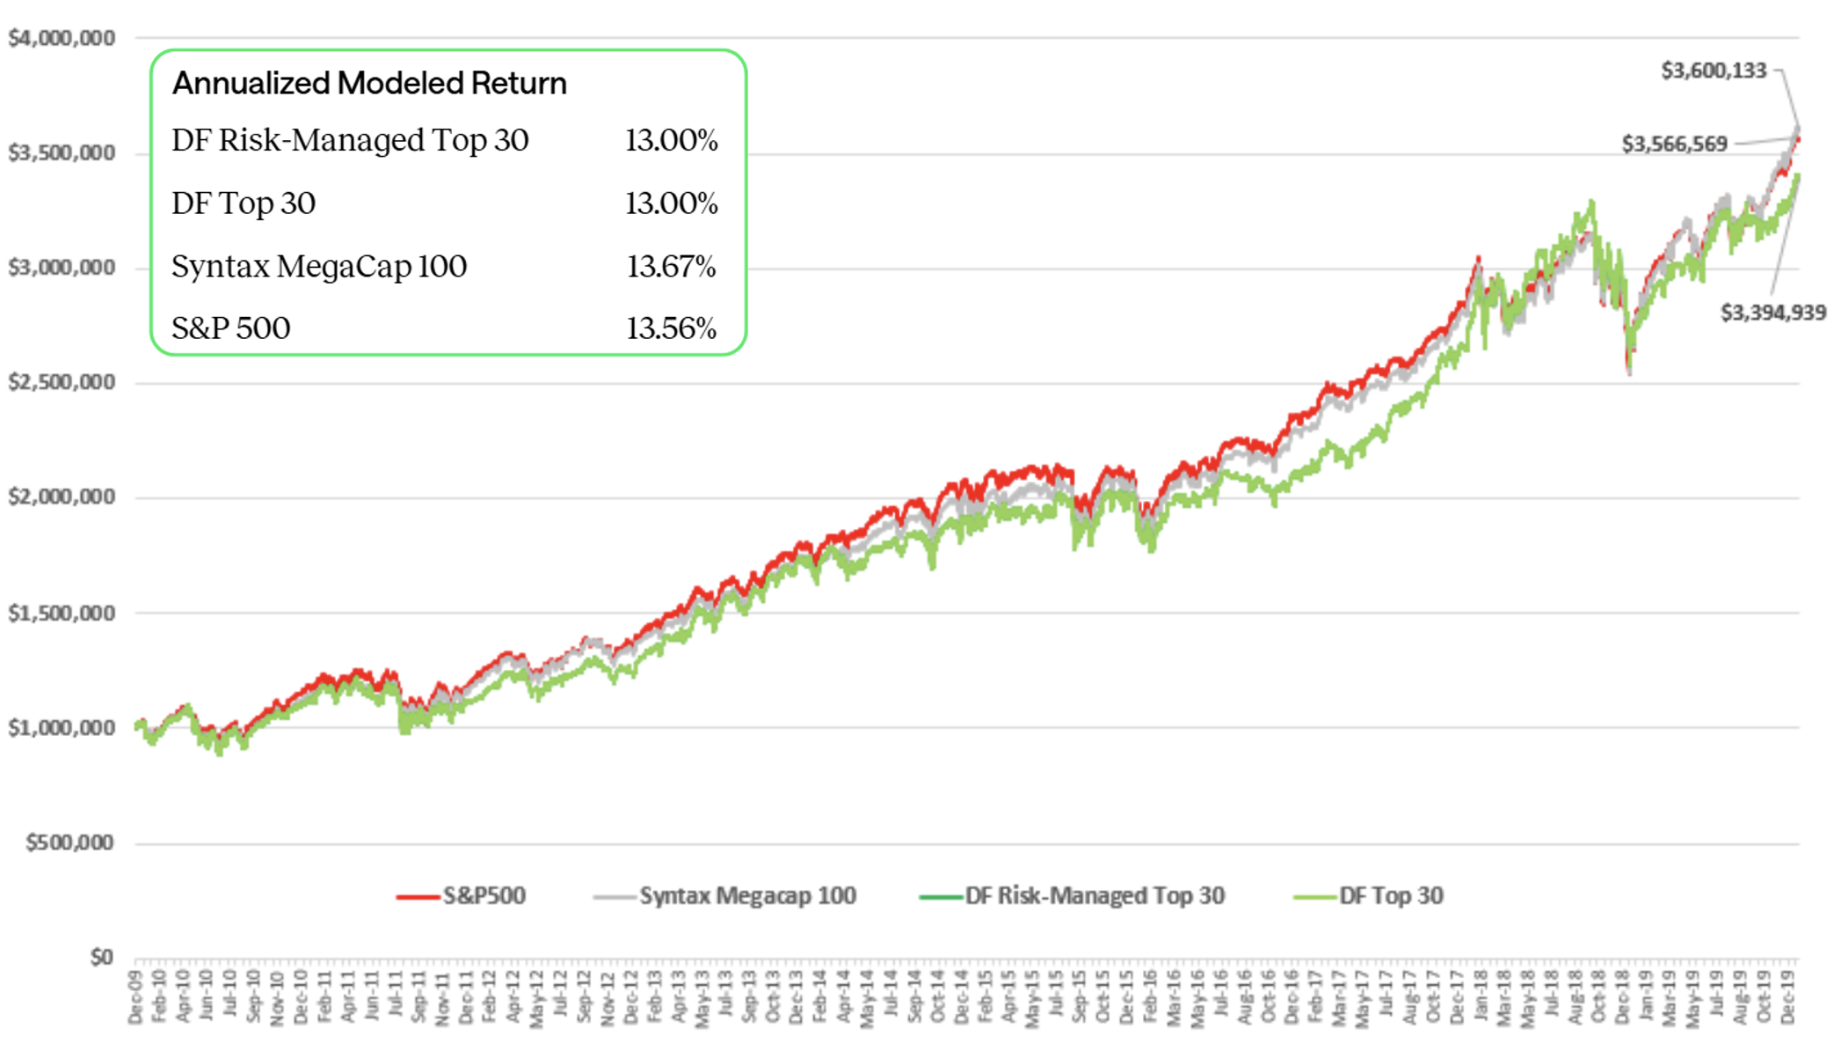
The results are within the range of expectations during this period of exceptional returns. A hypothetical $1 million in both the DF Risk-Managed Top 30 Index and the DF Top 30 Index grew to $3.39 million, gross of fees and expenses, which was cumulatively 6% lower than the Syntax MegaCap 100 Index. On an annualized basis, the DF momentum indices returned 13.0% per the backtest, underperforming the SY100 index return of 13.67% by 67 basis points. The modeled SY100 generated similar returns to the S&P 500 over this period.
Volatile Decade To Date
The period from 12/31/2019 through 9/30/25 exhibited volatility in both directions. On the downside, the COVID-19 Pandemic shocked the market and created a sharp drawdown, while in 2022, a market decline led by tech stocks created a bear market in the S&P 500 and other large cap indices. On the upside, the government’s fiscal response to the pandemic led to a surprisingly quick recovery, and the 2022 bear market was soon in the rearview mirror following consecutive years of 20% plus returns for the S&P 500 fueled by the market’s continued infatuation with the Magnificent Seven and the growing acceptance of possibilities created by AI. Exhibit 10 shows the growth of a hypothetical $1 million investment over this period.
Exhibit 10: Modeled Growth of $1 million: DF Risk-Managed Top 30 and DF Top 30 Indices vs. Syntax MegaCap 100 Index: 12/31/2019 to 4/30/2025

The DF Top 30 Index produced the highest results during this period based on the backtest. Gross of fees and expenses, the hypothetical $1 million investment grew to $2.6 million (an 18.1% annualized return), outperforming the risk-managed version of the index which grew to $2.5 million (17.5% annualized return). Both indices outperformed the Syntax MegaCap 100 benchmark which grew to $2.5 million (17.4% annualized return), though the risk-managed version did so by only a razor-thin margin. Market reversals occurred swiftly, especially during the 2020 pandemic-related downturn so the threshold required to trigger a move into treasuries was never crossed in the model. The trigger to move into treasuries in the model was initiated a few years later in October 2022, but this turned out to be relatively short-lived as the market began its rally in January 2023 and the trigger back into equities was executed in the model in February 2023. Like in 2020, the April 2025 volatility was similarly too ephemeral to trigger a switch to treasuries in the model. The S&P 500 underperformed all the other modeled indices by over 200 basis points annually.
The Bull and Bear Trigger History
The favorable results of the DF Risk-Managed Top 30 Index to both the DF Top 30 Index and the Syntax MegaCap 100 benchmark in the backtest were driven most importantly by:
- The model avoided significant drawdowns in the first decade of the century. This approach safeguarded principal in the model from the losses associated with both the bursting of the Tech Bubble and the Global Financial Crisis.
- The simulation does not incur material performance deficits, thereby avoiding lengthy recovery periods. In the model, this led to a significantly larger asset base at the end of the first decade that allowed the Index to benefit from the compounding of high market returns over the remainder of the backtest.
Having benefited from being fully invested in the model following the trigger into treasuries during the Global Financial Crisis, it would be roughly 13 years before the model triggered a return into treasuries in 2022. Exhibit 11 highlights that over the roughly 24-years of modeled performance, the move to treasuries was triggered just three times, with the last move being a relatively short 76 trading days (roughly four months) as the market recovered quickly from the tech led 2022 downturn. Over the life of the backtest, the Index was invested in treasuries for about 3 years or 12.5% of the time.
Exhibit 11: Modeled Tactical Allocations for DF Risk-Managed Top 30 Index by Year
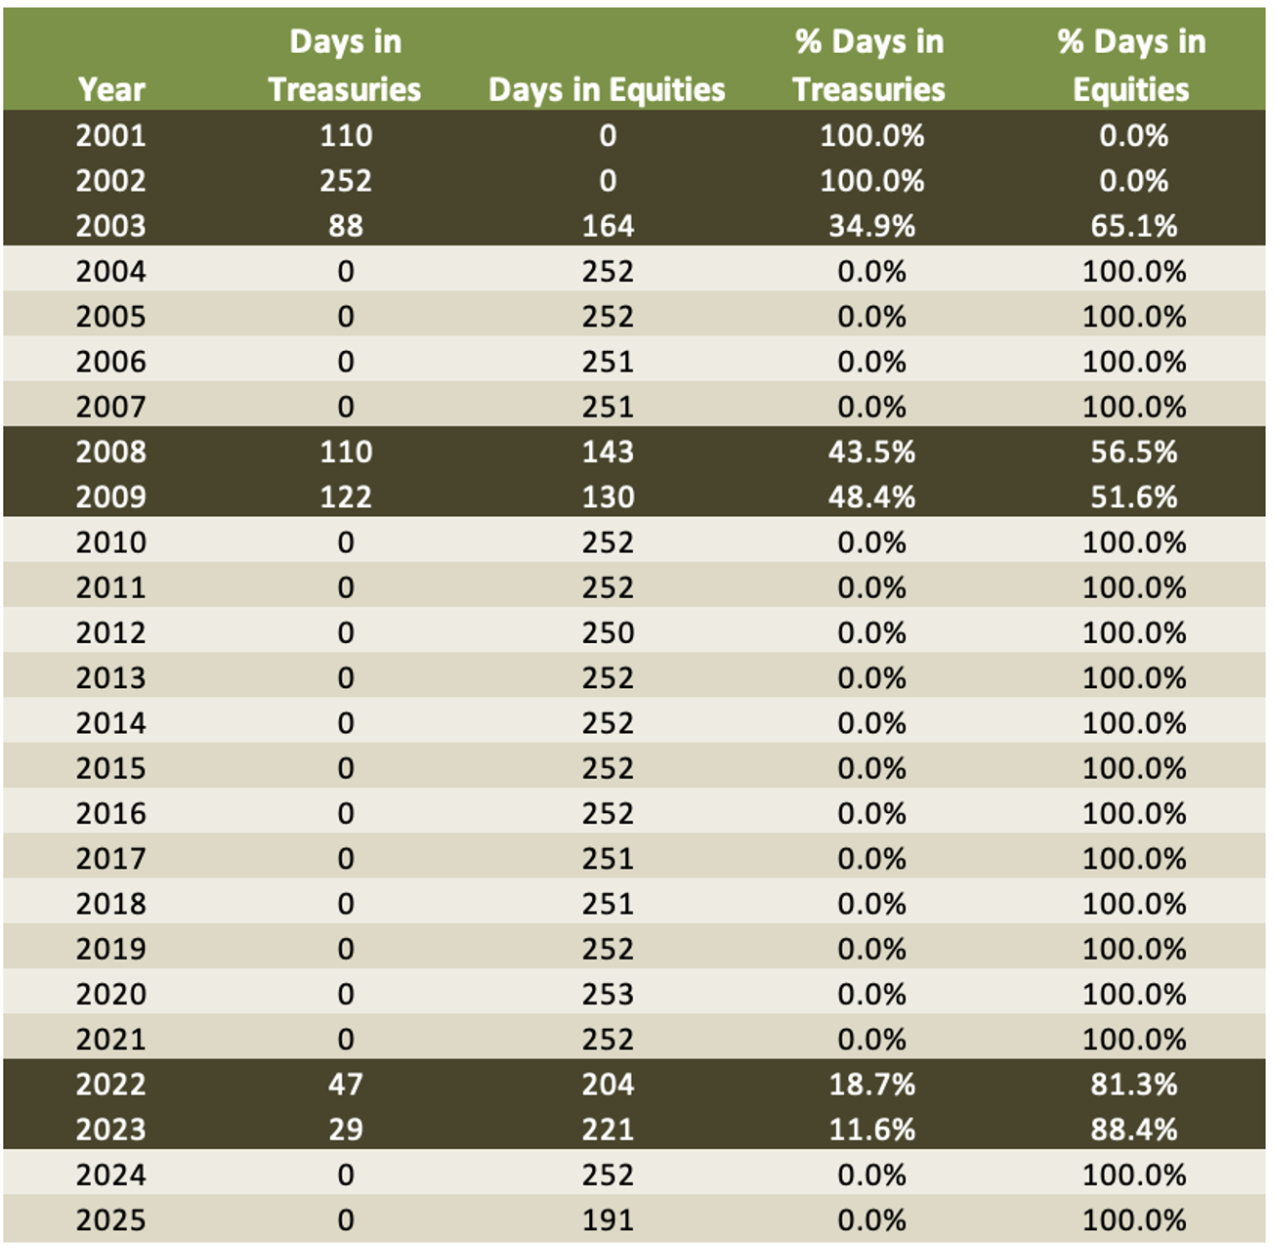
Exhibit 12 shows that the length of the largest drawdown for the modeled Risk-Managed Top 30 Index was 33 days, with a recovery period of 100 days. In contrast, the Syntax MegaCap 100 Index drawdown lasted 517 trading days, and the recovery period was a very lengthy 1120 days.
Interestingly, these two worst modeled drawdowns occurred in two different periods. The DF Risk-Managed Top 30 Index’s was incurred in the model during the COVID-19 Pandemic, whereas the benchmark’s largest drawdown would have been realized during the Global Financial Crisis.
Exhibit 12: Modeled Maximum Drawdown Statistics: DF Risk-Managed Top 30 Index vs. Syntax MegaCap 100 Index

Performance Considerations
The DF Top 30 Index, without the use of an overlay, performed favorably in the backtest, gross of fees and expenses, relative to the Syntax MegaCap 100 Index, highlighting the potential benefits of a momentum-based strategy. This index exhibited a modeled return pattern that had similarities to its mega cap benchmark. The DF Risk-Managed Momentum Index, with its tactical overlay, produced more differentiated results in the model compared to the same benchmark, driven primarily by its performance in the first decade of this century marked by two long, extended bear markets as noted above. Exhibit 13 is a modeled comparison of the DF Risk-Managed Top 30 Index to the Syntax US MegaCap Benchmark across three metrics: standard deviation, annualized returns, and cumulative returns.
Exhibit 13: DF Risk-Managed Top 30 Index: Modeled Returns and Risk Metrics vs. Syntax MegaCap 100 and S&P 500 Indices

Cumulative Returns: The cumulative returns as modeled for the DF Risk-Managed Top 30 Index narrowly underperform the Syntax MegaCap 100 Index over all time periods from 1 to 15 years. The cumulative since inception modeled return of 2060% for the DF Risk-Managed Top 30 Index far exceeds the 799% cumulative modeled results for the benchmark driven by the simulated avoidance of drawdowns in the lost first decade of the 2000’s. Modeled performance is stronger relative to the S&P 500 over all horizons except the trailing 5 years.
Annualized Returns: The modeled DF Risk-Managed Top 30 Index had a 44 basis point underperformance against the benchmark over the past year and 46 basis point underperformance in the past 3 years, driven primarily by the strong returns of the megacap universe in recent times. Given the strength of megacap stocks, modeled performance relative to the S&P 500 is rosier. The since inception modeled return of 13.54% was 404 basis points ahead of the 9.50% for the benchmark, once again driven by performance during the Lost Decade.
Standard Deviation: The modeled volatility of the modeled DF Risk-Managed Momentum Top 30 Index was higher than the benchmark over the past 1 and 3 years, but for modeled periods of 5 to 15 years, it demonstrated benchmark-like risk. The since inception modeled volatility of 13.62% was 119 basis points lower than the benchmark, tied to the time spent in treasuries.
Conclusion
The modeled analysis, before fees and expenses, showed the momentum-based DF Top 30 Index can be an attractive strategy based on its sound construction and modeled results relative to the S&P 500, S&P 100, and Syntax MegaCap 100 indices. The simulation also showed that momentum strategies are not without risks. Consistent with academic research, this index struggled, along with the benchmark, in long-lasting bear markets that occurred in the earlier years of the backtest. The DF Risk-Managed Top 30 Index, with its rules-based tactical overlay, was designed to capture the benefits of momentum while seeking to mitigate the risks associated with extended bear markets. In the backtest, it successfully navigated the drawdowns associated with the bursting of the Tech Bubble and the Global Financial Crisis, which posed the greatest risk to wealth accumulation during the backtest period. The model did not trigger the move to treasuries during the COVID drawdown, so while it experienced the market shock of this drawdown, it also experienced the rapid recovery in the simulation. Based on how returns unfolded during the full backtest period, the Risk-Managed Index found a good balance in the model between being fully invested and moving to treasuries on the occasions when risks of an extended bear market appeared. The favorable results tied to the protection of principal in the earlier years of the backtest sowed the seeds for the strong cumulative modeled return outperformance.
An additional consideration for the DF Risk-Managed Top 30 Index is that it prioritizes stocks with the highest price momentum scores. As a result, sector allocations remain fluid, adjusting quarterly based on the latest benchmark assessments. Historical backtesting revealed that the index has cycled in and out of the Magnificent Seven in the model, acquiring individual member stocks as their momentum increased and selling them when they were outpaced by others. While the future remains uncertain, the index’s rules-based methodology ensures a continued rotation into stocks demonstrating price leadership. A prime example is Nvidia, currently the largest index holding at 11.6%
While the DF Top 30 Index is relatively concentrated with 30 holdings, and the top ten holdings have averaged 44% of the Index’s weight over time, its modeled volatility did not vary meaningfully from the benchmark when the strategy was fully invested in equities, and the since inception modeled results were less volatile, tied to the time spent allocated to treasuries when the bearish trigger was executed in the simulation.
The Index may appeal to those with substantial equity holdings seeking to limit downside risk. It also offers a tactical approach to large-cap stocks relative to the persistent technology biases found in the US large cap and broad market indices, while also potentially mitigating the risk of the Magnificent Seven stocks reverting to the mean.
You can learn more about the DF Risk-Managed Momentum Index at www.syntaxdata.com or by emailing sgrieco@syntaxdata.com. To learn more about Donoghue Forlines, please email Info@DonoghueForlines.com.
Disclaimers
Past performance is no guarantee of future results. All performance of the DF Tactical Top 30 and the DF Risk-Managed Tactical Top 30 indices prior to their May 8, 2025 inception is backtested. All performance of the Syntax MegaCap 100 Index prior to its April 25, 2025 inception is backtested. Backtested performance is not actual performance but is hypothetical and is suitable only for institutional audiences. Backtested performance may not be predictive of actual or future performance. Backtested data may reflect the application of the index methodology with the benefit of hindsight, and the historic calculations of an index may change from month to month based on revisions to the underlying economic and/or financial data used in the calculation of the index. Charts and graphs are provided for illustrative purposes only. S&P® is a registered trademark of S&P Global and/or its affiliates. Syntax® is a registered trademark of Syntax, LLC and/or its affiliates.
The DF Tactical Top 30 Index and DF Risk-Managed Tactical Top 30 Index (the “Indices”) are the property of Donoghue Forlines LLC. Syntax LLC is the administrator of the Indices. Funds or portfolios tracking the Indices are not sponsored by Syntax LLC or its third-party licensors. The Syntax US MegaCap Index is the property of Syntax LLC, which is the administrator of the index.
The results shown do not represent the results of actual trading using client assets but were achieved by means of the retroactive application of an investment process that was designed with the benefit of hindsight, otherwise known as back-testing. Thus, the performance results noted above should not be considered indicative of the skill of the advisor or its investment professionals. The back-tested performance was compiled after the end of the period depicted and does not represent the actual investment decisions of the advisor. These results do not reflect the effect of material economic and market factors on decision making. In addition, back-tested performance results do not involve financial risk, and no hypothetical trading record can completely account for the impact of financial risks associated with actual investing.
Index performance does not represent actual fund or portfolio performance, and such performance does not reflect the actual investment experience of any investor. An investor cannot invest directly in an index. In addition, the results actual investors might have achieved also would have differed from those shown because of differences in the timing, amounts of their investments, and fees and expenses associated with an investment in a portfolio invested in accordance with an index. The indices portrayed herein do not charge management fees directly to end investors or incur brokerage expenses, and no such fees, implementation costs or expenses were deducted from the performance shown; provided, however, that the returns of any investment portfolio invested in accordance with such indices would be net of such fees, implementation costs and expenses. Additionally, none of these indices lend securities, and no revenues from securities lending were added to the performance shown.
This research report is for informational purposes only and is not intended to be, nor should it be construed or used as an offer to sell, or a solicitation of any offer to buy, any security or investment vehicle, nor should it be redistributed. Additionally, the information herein is not intended to provide, and should not be relied upon for, legal advice, tax advice, financial advice, or investment advice. You should make an independent investigation of the matters described herein, including consulting your own advisors on the matters discussed herein. In addition, certain information contained in this research document has been obtained from published and non-published sources prepared by other parties, which in certain cases have not been updated through the date hereof. While such information is believed to be reliable for the purpose used herein, such information has not been independently verified by Syntax and Syntax does not assume any responsibility for the accuracy or completeness of such information. Syntax LLC, its affiliates and their independent providers, are not liable for any informational or technical errors, incompleteness, or delays, or for any actions taken in reliance on information contained herein. This document and the information it contains should not be reproduced, redistributed, or used without the prior written consent of Syntax LLC. Distribution of Syntax data and the use of Syntax indices, data, software, or technology to create financial products require a license with Syntax and/or its licensors. Investments are not FDIC insured, may lose value and have no bank guarantee.
1. https://www.spglobal.com/spdji/en/research-insights/spiva/
2. The EMA is an average of returns over a specified time period, weighted more heavily toward more recent results while still considering historical data.
3. 212 Years of Price Momentum (The World’s Longest Backtest: 1801–2012), Christopher C. Geczy, PH.D., Mikhail Samonov, CFA, December, 2013
4. Fact, Fiction and Momentum Investing, AQR, September 2014
5. Cited in Momentum Investing: It Works, But Why? - UCLA Anderson Review, October 2018
6. The average modeled exposure to the Magnificent Seven in the DF Top 30 Index (without the overlay) was 12.27% compared to 11.86% for the DF Risk-Managed Top 30 Index (with the overlay) from 9/21/2001 to 9/10/2025.