

Key Takeaways
- When FTSE Russell’s Industry Classification Benchmark (ICB) is combined with the company product line data found in Syntax’s FIS® system, investors can gain new perspectives on their investments. The following are insights generated when this technology is applied to the Russell 1000 index.
- 75% of companies in the Index have three or more product lines; 65% span multiple sectors.
- There are over 6,600 product lines representing 238 distinct business activities within the Index.
- Product line data reveals the complexity of company revenue streams—e.g., Berkshire Hathaway and Cummins each report 17 distinct lines.
- There are 94 technology companies offering products with unattributable revenue, often tied to emerging areas like AI and quantum computing.
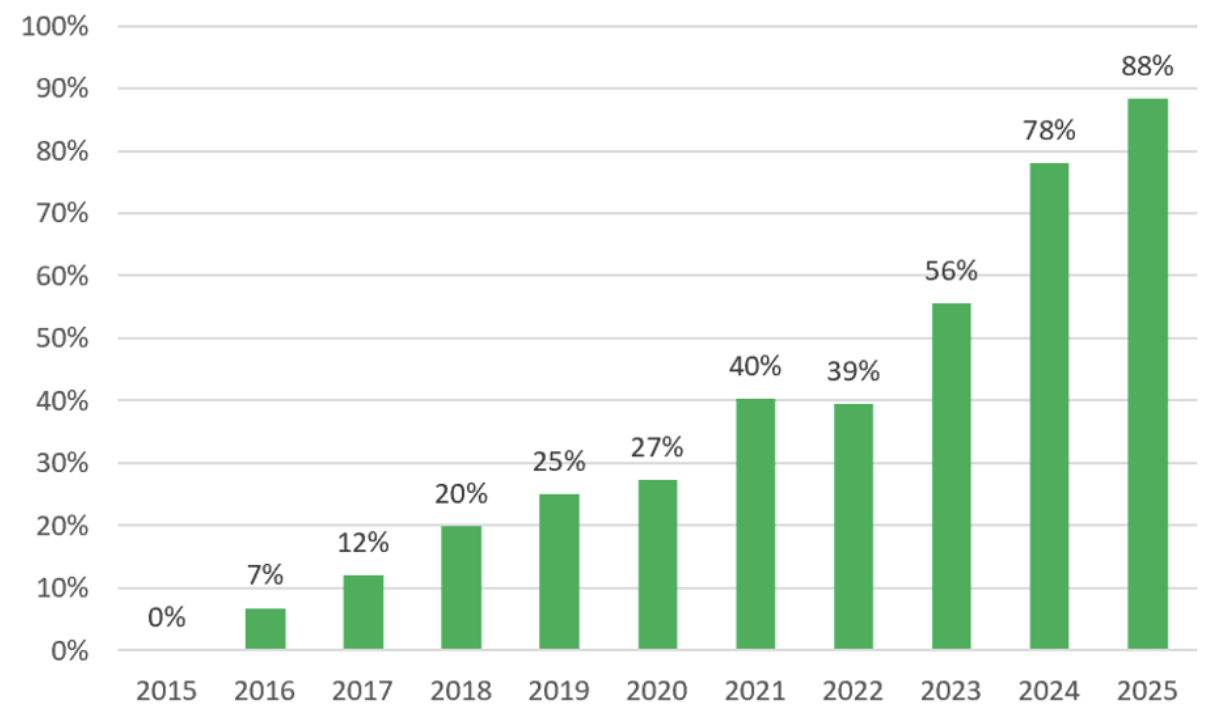
- 88% of Nvidia’s revenue is now tied to their AI chip platform; they also detail five product lines with unattributable revenue.
This paper provides insights into how an additional sector lens combined with company product line detail can help address the limitations of traditional sector analysis due to the growing complexity of US large cap companies. As companies diversify and evolve, traditional sector classifications may obscure key insights. A more granular approach can reveal hidden data, patterns and opportunities.
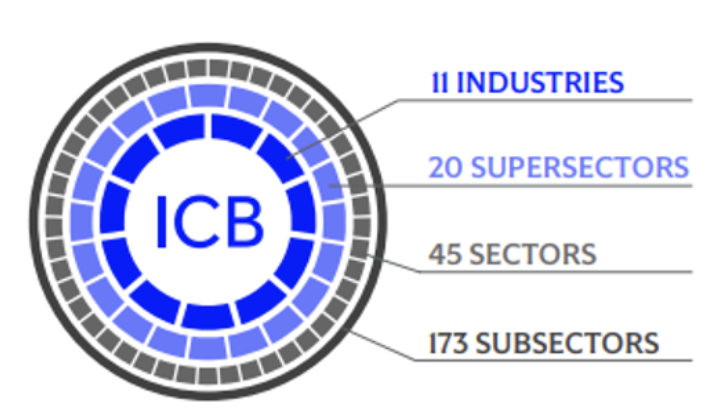
When investors evaluate benchmarks or managers, exposure data is often aggregated to simplify analysis and decision making. FTSE Russell publishes sector indices using its Industry Classification Benchmark (ICB) framework, which assigns a company to one of 173 subsectors, rolling up through three additional levels into eleven representative industries based on the majority source of its revenues.
Exhibit 1: Industry Classification Benchmark (ICB) Framework
ICB offers a robust framework for analyzing companies, indices and portfolios, thanks to its four-tiered granularity. FTSE Russell further strengthens ICB’s analytical depth by integrating company product line data found in Syntax’s Functional Information System (FIS®), an advanced industry classification methodology. Using this technology, we take a deep dive into the Russell 1000 Index to identify nuances embedded in its holdings. Our analysis uncovers some interesting and fun facts on this well-known benchmark.
Why Granularity Matters
When discussing an index or a manager’s portfolio, we often speak in terms of exposure to a specific primary sector, like Healthcare or Financials within the ICB framework. These primary sectors, however, are just the top layer of a detailed taxonomy or tree structure. Exhibit 2 summarizes the structure of the FIS® Sector taxonomy (in contrast, ICB’s four levels include 11 industries, 20 supersectors, 45 sectors and 173 subsectors).
Exhibit 1: Industry Classification Benchmark (ICB) Framework
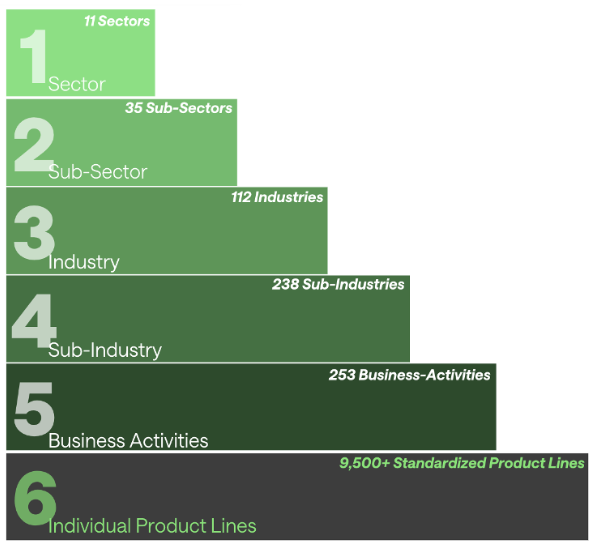
Making decisions or assessing risk based on the primary sector data can be overly simplistic. Evaluating an index or portfolio using Level 2 sub-sector data (35 categories) or Level 3 industry grouping (112 categories) may provide a more appropriate level of detail.
To illustrate how deeper classification reveals more detail, Exhibit 3 breaks down the Russell 1000 sectors to the product line level. The exhibit takes each of the eleven FIS® primary sectors (Level 1 above) within the Russell 1000 and breaks them all the way down to the number of product lines (Level 6) for each sector. The exhibit provides insights into the breadth and depth of each sector and the index overall.
Exhibit 3: Russell 1000 Sector Classification Detail Down to Product Line

While we think of the Russell 1000 as a representation of 1,000 of the largest companies in the US public equity market. We can also think of the Index as a massive conglomerate, a collection of 238 different business activities with over 6,600 product lines represented. Looking at the Index from this holistic perspective highlights the variation within the primary sectors. For example, Financials is broken into five sub-sectors whereas Healthcare and Technology have two sub-sectors. Industrials (43) and Consumer Discretionary (39) have the most business activities, but Industrials has far more product lines (1,113 to 733 for Consumer Discretionary). Energy and Utilities have the fewest categories across the board, highlighting a higher level of homogeneity when compared to the other primary sectors. These types of observations are lost when you look at the Index through a primary sector lens alone.
This granularity becomes even more powerful when we examine the individual product lines that drive company revenues.
Sector Complexity Revealed
The Russell 1000 has over 6,600 product lines, which means the average company in the Index engages in six different business lines. Exhibit 4 shows the distribution of the number of product lines across the companies in the Index.
Exhibit 4: Russell 1000 Companies by Number of Product Lines
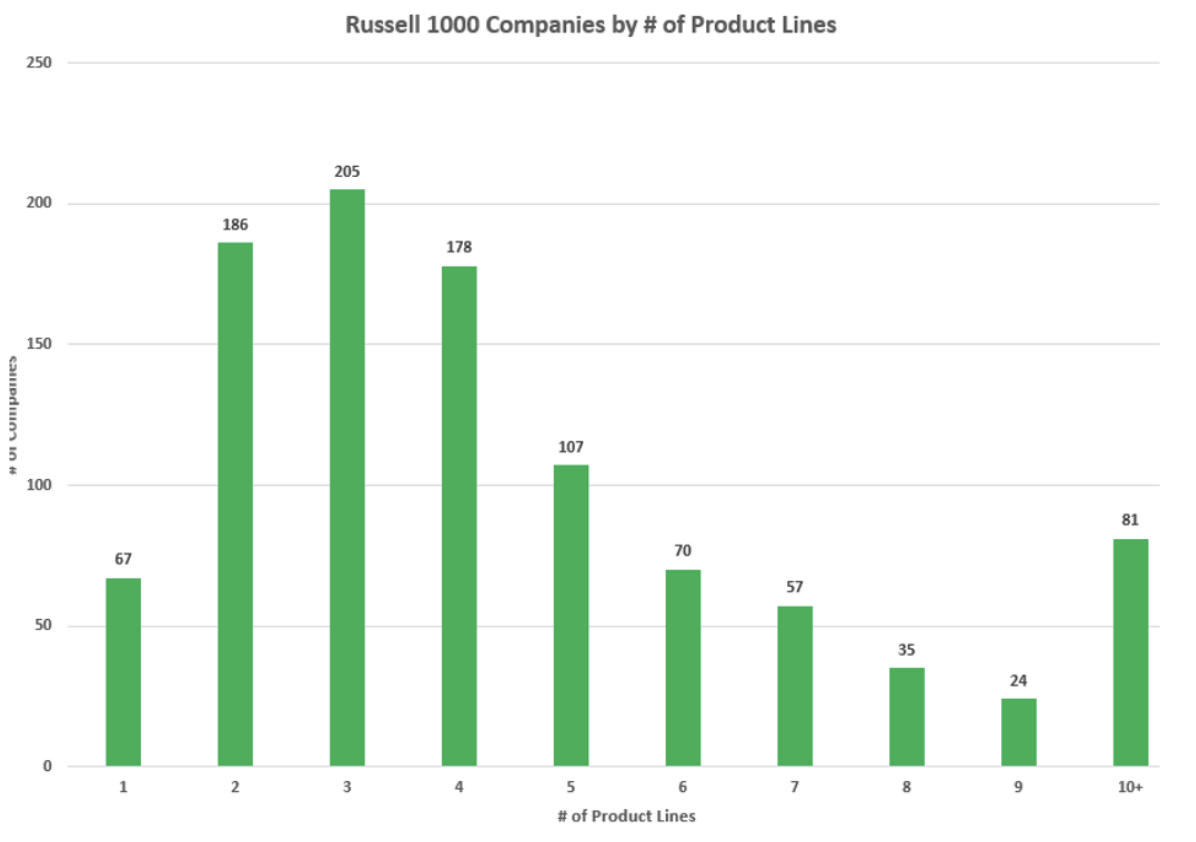
While most companies have a handful of product lines, roughly 10% of the Index has companies with 9 or more product lines. Some fun facts about product lines include:
- Berkshire Hathaway and Cummins Inc. have something in common – 17 product lines.
- Product line classifications can be very granular, like Corning Inc’s “Cover Glass for Consumer Electronic Displays; sold to OEMs”.
- Product lines can be shared by multiple companies (e.g., both Amazon and Microsoft engage in “Cloud Computing Services”) or can be specific to a single company (e.g. “Fastener Distribution to OEMs,” which accounts for 19.3% of Fastenal Co.’s 2024 revenues).
This product line detail can provide insights into a company’s business. Take Nvidia, for example, which is now the most valuable company in the world and represents 7.1% of the Russell 1000 as of September 30, 2025. Exhibit 5 shows the remarkable growth of Nvidia’s “Data Center Processors for Analytics and AI” product line, which accounts for their chips used to power AI applications and data centers.
Exhibit 5: Nvidia “Data Center Processors for Analytics and AI” Product Line as a Percent of Total Revenue
Unattributable Revenue: Hidden Innovation?
Additionally, many companies document product lines with no attributable revenue in their financial statements. Alphabet is a good example. Their financial statements include the following 10 product lines that do not have any attributable revenue:
- Contract Research for Drug Manufacturers
- Diversified Consumer Electronics (outsourced); retail sales
- Diversified Design and Engineering Services
- Licensing TV Content
- Movie Studio; Self-Distributed
- Perpetual License Self-Driving Software for Automobiles
- Private Equity
- Quantum Computing Systems for Businesses and Governments
- Venture Capital
- Wearable Consumer Electronics (outsourced); retail sales
Product lines with no attributable revenue can be found in every primary sector as shown in Exhibit 6. Not surprisingly, the Technology Sector (94) has the most companies reporting product lines with no attributable revenue, followed by Industrials (55).
Exhibit 6: Distribution of Unattributable Revenue Product Lines Across Primary Sectors

This information can be useful to investors as it points to areas of research and development and potential future product revenue. Emerging businesses often first appear as secondary and tertiary exposures of larger companies, and these insights are hidden when companies are analyzed only based on their primary sector. Nvidia’s revenue growth related to its AI chips was shown above, but they also have the following five product lines with no attributable revenue:
- GPUs for Cryptocurrency Mining
- GPUs for Edge Computing
- AI-Enabled SaaS Power Grid Management Software
- Perpetual License Quantum Computing Application Development Software; and
- Genetic, Genomic, and Sequencing Testing Software
Across the Russell 1000, we find 302 companies with at least one business line with no attributable revenue. Looking at what could be the potential next big thing, there are 12 companies with quantum computing-related product lines with unattributable revenue.
Multi-Sector Companies: A Mosaic of Business Models
Having identified that most Russell 1000 companies have multiple product lines, a logical next step is to look at how many companies are involved in one, two, or more sectors. Exhibit 7 identifies the distribution of Russell 1000 companies by the number of different sectors they have businesses in. The exhibit displays the distribution by company count and by market cap weight.
Exhibit 7: Percentage of Russell 1000 Companies with Businesses In One or More Sectors
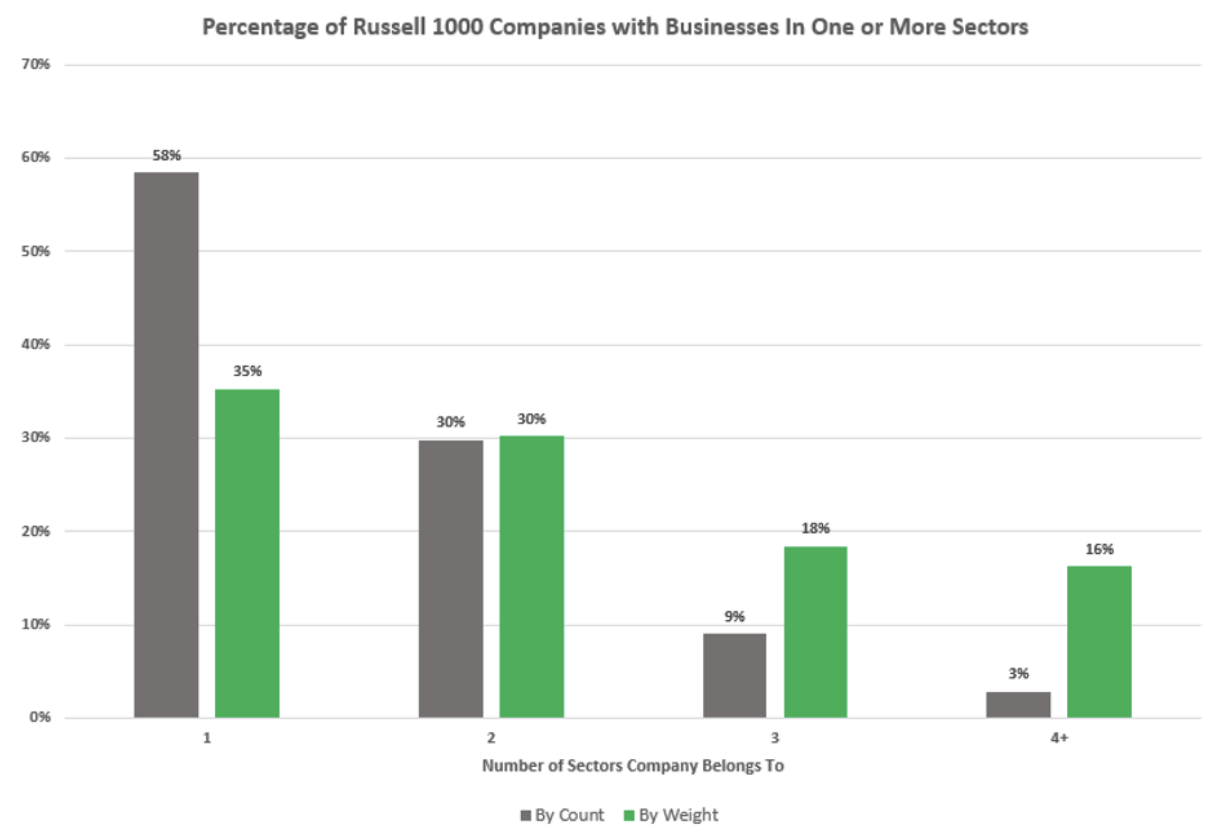
By count, 58% of companies have their business revenue generated in only one sector; but this amount falls to 35% when measured by market cap weight. This makes intuitive sense as larger companies are more likely to have both more product lines and businesses that fall outside their primary sector. Meanwhile, the number of companies by count and by weight that belong to two sectors are at 30% each. Only 3% of companies by count have revenue tied to four or more sectors, but by weight the amount increases to 16%.
3M is a good example as it has revenue that falls into four different sectors:
- Industrials (62%): Includes businesses classified as Capital Goods, including Industrial Equipment and Components (44%) and Electrical Equipment (18%).
- Consumer Discretionary (10%): Includes automotive and personal protection products.
- Consumer Staples (6%): This revenue is tied to home care products, including their famous Post-it notes, which, as the story goes, were invented by accident. The adhesive was originally developed by a 3M scientist in 1968 as a “low-tack” glue. It wasn’t until a colleague used it to mark pages in his choir book that the idea for sticky notes was born.[1]
Closing Comments
As investors seek deeper understanding and smarter strategies, the robust ICB framework combined with FIS® offers a powerful lens to uncover hidden risks and opportunities within familiar benchmarks. To truly grasp the richness of the Russell 1000 Index and understand the cross-section of sectors where US large cap companies operate, investors must look beyond sector labels and examine the breadth of business models within. With most companies operating across multiple product lines and often in different sectors, the Index is a mosaic of 238 business activities and over 6,600 distinct product lines. This granularity reveals how firms like Berkshire Hathaway and Cummins generate revenue across a wide array of segments, while others, like Nvidia, are much more concentrated. The insights shared highlight how a more granular approach to company and industry classification can sharpen investors’ view of both risk and opportunity. Importantly, increasing the level of detail also enhances transparency—giving investors a clearer, more informed understanding of the businesses they hold. If you would like to learn more, please contact sgrieco@syntaxdata.com or visit us at https://www.syntaxdata.com.
[1] History of Post-it® Notes | Post-it® Brand
About Syntax
Syntax Data is a New York-based technology company specializing in index technology and economic classification. The company provides data on public and private companies based on its patented system and leverages this data to offer financial indices via custom index services as well as a technology interface for designing personalized indices. Learn more at www.syntaxdata.com.
About FTSE Russell
FTSE Russell is a leading global provider of index and benchmark solutions, spanning diverse asset classes and investment objectives. As a trusted investment partner, we help investors make better-informed investment decisions, manage risk, and seize opportunities.
Market participants look to us for our expertise in developing and managing global index solutions across asset classes. Asset owners, asset managers, ETF providers and investment banks choose FTSE Russell solutions to benchmark their investment performance and create investment funds, ETFs, structured products, and index-based derivatives. Our clients use our solutions for asset allocation, investment strategy analysis and risk management, and value us for our robust governance process and operational integrity.
For over 40 years we have been at the forefront of driving change for the investor, always innovating to shape the next generation of benchmarks and investment solutions that open up new opportunities for the global investment community.
All information is provided for information purposes only. All information and data contained in this publication is obtained by the LSE Group, from sources believed by it to be accurate and reliable. Because of the possibility of human and mechanical error as well as other factors, however, such information and data is provided “as is” without warranty of any kind.
Disclaimers
This report is for informational purposes only and is not intended to be, nor should it be construed or used as an offer to sell, or a solicitation of any offer to buy, any security or investment vehicle, nor should it be redistributed. Additionally, the information herein is not intended to provide, and should not be relied upon for, legal advice, tax advice, financial advice, or investment advice. You should make an independent investigation of the matters described herein, including consulting your own advisors on the matters discussed herein. In addition, certain information contained in this sample letter has been obtained from published and non-published sources prepared by other parties, which in certain cases have not been updated through the date hereof. While such information is believed to be reliable for the purpose used in this sample letter, such information has not been independently verified by Syntax and Syntax does not assume any responsibility for the accuracy or completeness of such information. Syntax LLC, its affiliates and their independent providers are not liable for any informational or technical errors, incompleteness, or delays, or for any actions taken in reliance on information contained herein. Distribution of Syntax data and the use of Syntax indices, data, software, or technology to create financial products require a license with Syntax and/or its licensors. Investments are not FDIC insured, may lose value and have no bank guarantee.
FTSE Russell® is a trading name of FTSE, Russell, FTSE Canada, FTSE FI, FTSE FI Europe, YB and BR. “FTSE®”, “Russell®”, “FTSE Russell®”, “FTSE4Good®”, “ICB®”, “The Yield Book®”, “Beyond Ratings®” and all other trademarks and service marks used herein (whether registered or unregistered) are trademarks and/or service marks owned or licensed by the applicable member of the LSE Group or their respective licensors and are owned, or used under licence, by FTSE, Russell, FTSE Canada, FTSE FI, FTSE FI Europe, YB or BR. FTSE International Limited is authorised and regulated by the Financial Conduct Authority as a benchmark administrator.
No member of the LSE Group nor their respective directors, officers, employees, partners or licensors make any claim, prediction, warranty or representation whatsoever, expressly, or impliedly, either as to the accuracy, timeliness, completeness, merchantability of any information or of results to be obtained from the use of FTSE Russell products, including but not limited to indexes, data and analytics, or the fitness or suitability of the FTSE Russell products for any particular purpose to which they might be put. Any representation of historical data accessible through FTSE Russell products is provided for information purposes only and is not a reliable indicator of future performance.