

Key Takeaways
- Studies have shown that momentum strategies have earned a market risk premium over time in the US public equity markets.
- The research also shows that momentum strategies struggle and underperform in long bear markets.
- The DF Risk-Managed Momentum Index seeks to realize the potential benefits of a momentum strategy while mitigating the downside risk of long bear markets by using a tactical overlay that can move the index to treasuries when return trends turn bearish.
- The index enhances diversification benefits by screening eligible companies for positive cash flow, applying a sector neutral allocation strategy, and equally weighting securities to avoid individual security concentration risk.
Overview
Mark Twain once said, “the secret of getting ahead is getting started.” Once a person sets a goal and takes a first action, momentum can be powerful. This can apply to an individual maintaining an exercise routine or increasing responsibilities at work to attain a promotion.
Momentum is also an investment strategy of buying assets with an upward price trend and selling them once signals indicate that they may have peaked. In this paper, we highlight two indices designed in collaboration between1 Donoghue Forlines LLC and Syntax Data that target strong risk-adjusted returns by mitigating downside risk, capturing the potential benefits of momentum:
- The DF Momentum Index is an equity index that holds companies exhibiting momentum characteristics.
- The DF Risk-Managed Momentum Index is the above index with a tactical overlay that can move to 100% treasuries when certain bearish conditions are present.
The index construction and backtested performance for both indices are discussed, and performance is compared to the Syntax US LargeCap Index (SY500), a market capitalization-weighted measure of US large cap companies comparable to the S&P 500. Both indices were constructed and are calculated and maintained by Syntax Data.
The History of Momentum
The history of momentum from an investment research perspective dates back to 1993 when the Journal of Finance published a study by Narasimhan Jegadeesh and Sheridan Titman in which they concluded:
“Strategies of buying recent stock winners and selling recent losers generated significantly higher near-term returns than the U.S. market overall from 1965 to 1989…a stock’s relative performance over the previous three to 12 months typically predicted its relative performance for the following three to 12 months.”2
More recent research has pointed to a similar conclusion. In their September 2014 paper titled Fact, Fiction, and Momentum Investing, Clifford S. Asness, Andrea Frazzini, Ronen Israel, and Tobias J. Moskowitz noted:
“Momentum is the phenomenon that securities which have performed well relative to peers (winners) on average continue to outperform, and securities that have performed relatively poorly (losers) tend to continue to underperform. The existence of momentum is a well-established empirical fact.” 3
The research also pointed out that momentum, like any investment strategy, does not work all the time. In research that confirmed the presence of momentum in the US public equity market from 1801 to 2012, Christopher Geczy and Mikhail Samonov noted that momentum strategies fail in volatile, long-lasting bear markets such as those that occurred in the 1930s and 2000s. The paper also highlighted the following observation: “A dynamically hedged momentum strategy significantly outperforms the un-hedged strategy.”4 That is, combining momentum strategies and hedging techniques may help investors mitigate the drawdown risk associated with long lasting bear markets, which in turn may support higher risk-adjusted returns.
Momentum Index Construction
Momentum-based strategies come in different flavors. A pure momentum strategy may start by ranking stocks by their performance over a specified period and selecting the highest ranked stocks. The weight of each stock could be determined in a number of ways, including by weighting proportional to market capitalization, equally weighting, or using a momentum score to modify the weight. The DF Momentum Index selects stocks from the Syntax US LargeCap 500 Index based on the following screens and criteria:
- Companies must have positive trailing 12-month free cash flow, defined as Funds from Operations - (Capital Expenditures + Cash Dividends Paid). This is a quality screen designed to avoid stocks that could be considered speculative.
- Companies must have a three-month average daily trading volume of greater than $10 million to provide sufficient liquidity in selected holdings.
After applying these screens, the remaining eligible constituents are ranked within each sector by their average monthly Sharpe ratio over the trailing three months. The index targets a total of 50 stocks to select and sets a target constituent count for each sector proportional to the weight of the sector in the SY500; that is, if a sector is 20% of the weight of the SY500, the target count for that sector will be 10 constituents. Constituents are then selected by descending rank order within each sector until the target count is met. Once all 50 holdings are determined, the index equally weights them at a 2.0% weight each to mitigate individual security risk. This process is repeated with updated momentum scores as the index reconstitutes each quarter.
The Risk-Managed Momentum Index applies a tactical overlay to switch between the Momentum Index when return trends are bullish, and treasuries when return trends are bearish. Over the 18+ year backtest period, the vast majority of periods have been bullish as the market has had a positive skew. But when markets turn, the math behind large drawdowns is challenging to investors – a 33% decline in a portfolio requires a 50% return to get back to breakeven. To use an analogy, the risk-managed overlay is similar to using bumper guards in a bowling alley to avoid a gutter ball. The overlay is a potential source of downside protection, serving as a guide rail to help keep the index moving towards its objective of generating capital appreciation.
The overlay utilizes two triggers that calculate the exponential moving average (EMA)5 of the Syntax US LargeCap 500 Index over intermediate-term and longer-term trends. These calculations are used to create both a bearish and bullish signal to trigger asset allocation changes.
- Bearish trigger: if the longer-term EMA calculation is less than 1, it means intermediate-term returns are trending below longer-term returns, which implies returns are in a deterioration trend. This triggers the index to move the allocation to treasuries, seeking to avoid drawdowns.
- Bullish trigger: if the intermediate-term EMA calculation is greater than 1, it implies that market sentiment has improved, triggering a move to momentum equities.
These signals are calculated daily at the market close and at times may both be bullish, both bearish, or one bullish and one bearish. The decision to move into treasuries is always determined by the bearish signal and the decision to move into equities is driven by the bullish signal. When a change is triggered, the Risk-Managed Momentum Index changes its allocations effective as of the market open two trading days later.
If the tactical overlay points to an equity allocation, the holdings remain in the index until the next quarterly reconstitution when the stocks in the universe are rescored, and the index holdings are updated. Like other momentum strategies, these indices typically have high turnover as they rotate into securities with favorable trends. This may make portfolios tracking the indices relatively tax inefficient and therefore they may be best suited for tax-efficient vehicles or tax-deferred retirement vehicles.
Backtested performance
To test the effectiveness of the stock selection process and the tactical overlay, Syntax simulated a backtest from 10/18/2006 through index inception on 12/17/2024 for the DF Momentum Index and 1/2/2025 for the DF Risk-Managed Momentum Index.6 The results of the DF Momentum Index backtest and since-inception live index calculations through 2/28/2025 are shown in Exhibit 1; the results of both momentum indices are shown in Exhibit 2.
Exhibit 1: Hypothetical Growth of $1,000: DF Momentum Index vs. Syntax US LargeCap 500 Index

A hypothetical investment of $1,000 in the Momentum Index at the start of the backtest grew to $7,711 by 2/28/2025, gross of fees and expenses, compared to $6,438 for the Syntax US LargeCap benchmark, a modeled outperformance of roughly 20% on a dollar basis. The Momentum Index7 returned 11.76% annually in the backtest compared to 10.67% for the benchmark, a modeled outperformance of 109 basis points. The results suggest that a momentum-based investment approach may earn a premium over a cap-weighted, market-based index, especially in the generally bull market conditions seen over the course of the backtest. Syntax similarly calculated a backtest for the DF Risk-Managed Momentum Index compared against the DF Momentum Index and the SY500 Index in Exhibit 2.
The results support the value of the overlay over the backtest period; the Risk-Managed Index reaches a modeled ending value of $11,290, gross of fees and expenses, which is 68% higher than the simulated $7,771 value for the DF Momentum Index, and 75% higher than the Syntax US LargeCap Index value of $6,438. On an annualized basis, the DF Risk-Managed Momentum Index returned 14.11% in the model, 234 basis points above the Momentum Index and 343 basis points above the SY500.
Exhibit 2: Modeled Growth of $1,000: DF Risk-Managed Momentum and DF Momentum Indices vs. Syntax US LargeCap 500 Index

The graph shows performance over three distinct market cycles, which we define as 1. the Global Financial Crisis; 2. the Low Volatility, Upward Trending Market, which roughly aligns with the decade starting in 2010; 3. the Bull & Bear Markets that have occurred in the past five years. Below we analyze performance during each of these market environments to assess the modeled effectiveness of the Momentum Index with and without the risk-managed overlay.
Global Financial Crisis
We define this period as the start of the backtest on 10/18/2006 through 9/30/2009. Exhibit 3 highlights that in the backtest, the Risk-Managed Momentum Index had a cumulative gain of 39.8%, performing very well in the model relative to both the Momentum Index and the large cap benchmark, which had cumulative losses of -5.8% and -15.8%, respectively.
Exhibit 3: Modeled Growth of $1,000: DF Momentum and DF Risk-Managed Momentum Indices vs. Syntax US LargeCap 500 Index: 10/18/2006 to 9/30/2009

- The dark green line of the Risk-Managed Momentum Index becomes apparent around July 2008. In fact, it is present from the start of the backtest, but up until this point, is invested identically to the Momentum Index in the model, as market conditions supported a 100% allocation to equities.
- When the market began to recover in March 2009, the backtested Risk-Managed Momentum Index was still in treasuries but moved back into the Momentum Index in the model around June of 2009. In July 2009, the backtested Risk-Managed Momentum Index began to exhibit the strong performance that is often seen with momentum strategies in market recoveries.
- The hedging action preserved capital in the model during this downturn, enabling the hypothetical investor to avoid material losses in the model. The Risk-Managed Momentum Index had a 48% and 66% higher balance in the simulation than the Momentum Index and the SY500 benchmark, respectively.
Low Volatility, Upward Trending Market
We define the Low Volatility, Upward Trending Market as the period from 9/30/2009 through 12/31/2019. Interestingly, while the market did have a few bumps in the road, most notably in Q4 2018, the overall trend in volatility and returns was consistently positive, so much so that the trigger in the model to move from equities to treasuries was never executed.
Exhibit 4: Modeled Growth of $1,000: DF Momentum and DF Risk-Managed Momentum Indices vs. Syntax US LargeCap 500 Index: 9/30/2009 to 12/31/2019

The results are consistent with expectations during this period of exceptional returns. A hypothetical $1,000 investment in the Momentum Index, with and without the overlay, grew to $4,222, gross of fees and expenses, which was 11% higher than the Syntax LargeCap 500 Index. The Momentum Indices returned 15.09% annually during this modeled period compared to 13.91% for the benchmark.
Bull and Bear Markets
The period from 12/31/2019 through 2/28/25 exhibited volatility in both directions. On the downside, the COVID-19 Pandemic shocked the market and created a sharp drawdown. In 2022, a market decline led by tech stocks created a bear market in the S&P 500 and other large cap indices. On the upside, the government’s fiscal response to the pandemic led to a surprisingly quick recovery, and the 2022 bear market was soon in the rearview mirror following consecutive years of 20% plus returns for the S&P 500 fueled by the market’s continued infatuation with the Magnificent 7 and the growing acceptance of possibilities created by AI. Exhibit 5 shows the growth of a hypothetical $1,000 investment over this period.
Exhibit 5: Modeled Growth of $1,000: DF Momentum and DF Risk-Managed Momentum Indices vs. Syntax US LargeCap 500 Index: 12/31/2019 to 2/28/2025

During this period, the modeled DF Risk-Managed Momentum Index grew to $1,913 compared to $1,938 for the Momentum Index, each gross of fees and expenses. These modeled results represent an underperformance of about 5% on a dollar basis relative to the $2,014 ending value for the Syntax 500 LargeCap Index. The market reversals during this time were relatively quick, particularly for the pandemic-related drawdown in 2020, so the trigger to move into treasuries never hit its required threshold as modeled during the pandemic. The trigger in the model to move into treasuries was initiated a few years later in October 2022, but this turned out to be relatively short-lived as the market began its rally in January 2023 and the trigger back into equities was executed in the simulation in February 2023. While this period was volatile, overall annualized modeled returns were strong, as the Risk-Managed Momentum Index returned 13.38% in the backtest compared to 13.66% for the Momentum Index, each gross of fees and expenses, both underperforming the Syntax LargeCap 500 Index return of 14.51%.
It is difficult to discuss this period in U.S. public equities without acknowledging the Magnificent Seven. In Q4 of 2024, we published Measuring the Impact of the Magnificent Seven on Market Returns with Syntax Direct. For the five years ending August 31, 2024, the Magnificent Seven as a group returned 30.3% per year, increasing their collective float-adjusted market cap from $4 to $14 trillion. At yearend 2024, the Magnificent Seven represented about one-third of the U.S. large cap market. Over the past five years, the Momentum Indices, with and without the overlay, held an average weight in the backtest to these companies of just 3.3%.
While both momentum indices slightly underperformed the benchmark through this period of bull and bear markets, that returns were close with little exposure to the Magnificent Seven is a respectable outcome. Over the modeled life of the Momentum Indices, the role of the Magnificent Seven has been limited. Exhibit 6 shows the weight of this group in the simulation has ranged from 0% to 12%, but over the period of the backtest, the average holdings have been 2.7% for the Risk-Managed Momentum Index and 2.8% for the Momentum Index.
Exhibit 6: Modeled DF Risk-Managed Momentum Index Target Exposure to The Magnificent Seven

The Bull and Bear Trigger History
There is considerable literature highlighting the prospective benefits of remaining fully invested at all times. Still, many investors had to extend their retirement plans to recoup losses driven by the significant drawdown experienced during the Global Financial Crisis. The DF Risk-Managed Momentum Index seeks to find a way to balance these objectives. Exhibit 7 highlights that the move to treasuries, based on the backtest, have been infrequent. The bearish trigger has happened just twice in the model covering a span of four different years (shaded in dark gray). For the 18+ year backtest history, the overlay index was invested in treasuries for roughly 1.1 years or 6% of the time.
Exhibit 7: Modeled Tactical Allocations for DF Risk-Managed Momentum Index by Year

Portfolio Considerations
The DF Momentum Index performed well in the model relative to the Syntax US LargeCap 500 Index based on the backtest, highlighting the potential role of a momentum-based strategy in a portfolio. This index exhibited a return pattern that had similarities to its large cap benchmark. The Risk-Managed Momentum Index, with its tactical overlay, produced more differentiated results in the model compared to the same benchmark. Exhibit 8 is a modeled comparison of the Risk-Managed Momentum Index to the Syntax US LargeCap Benchmark across three metrics: standard deviation, annualized returns, and cumulative returns.
Exhibit 8: DF Risk-Managed Momentum Index: Modeled Return and Risk Metrics vs. Syntax US LargeCap 500 Index

Standard Deviation: The modeled Risk-Managed Momentum Index generally has a higher volatility over most time periods and was modestly higher than the benchmark in the simulation over 10- and 15-years at 1.05% and 0.55%, respectively. Over the course of the entire backtest, the volatility for the Risk-Managed Momentum index is lower, driven by the modeled risk reduction benefits of being in 100% treasuries during a portion of the Global Financial Crisis.
Annualized Returns: The modeled Risk-Managed Momentum Index had modest outperformance in both the one- and 15-year modeled periods. During the periods between these two end points (3, 5, and 10 years), there was modest underperformance in the backtest driven by the results during the “Bull and Bear Market” period of the past five years as shown in Exhibit 5. The backtest since inception results of the Risk-Managed Momentum Index (14.11%) were substantially higher than those of the benchmark (10.67%), a difference of 344 basis points.
Cumulative Returns: The returns here follow the annualized results but reflect the impact of compounding over each period. The item that stands out is the modeled since inception cumulative return of 1,029% for the Risk-Managed Momentum Index, which far exceeds the benchmark’s 544% result—a modeled difference of 485%. This substantial difference highlights the power of compounding and the benefit of avoiding losses as shown below.
In Exhibit 9, we highlight the two worst modeled drawdowns for both the DF Risk-Managed Momentum Index and the SY500 benchmark. Interestingly, the largest drawdown for each index occurred during different periods.
Exhibit 9: Modeled Maximum Drawdown Statistics: DF Risk-Managed Momentum Index vs. Syntax US LargeCap 500 Index
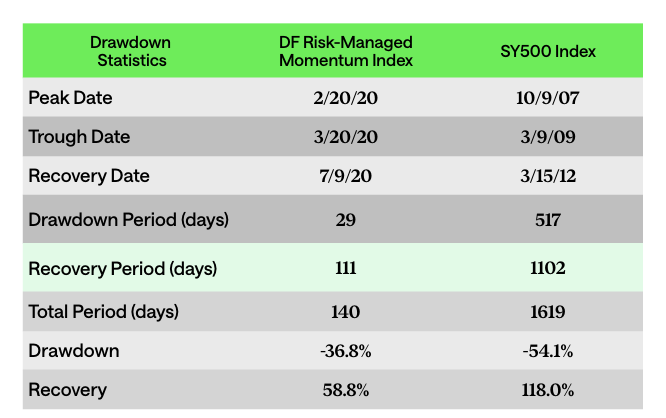
The Risk-Managed Momentum Index’s worst result was incurred in the model during the COVID-19 Pandemic, whereas the benchmark’s largest drawdown would have been realized during the Global Financial Crisis. The trend in returns during the Global Financial Crisis resulted in the bearish trigger being executed in the backtest for the Risk-Managed Momentum Index. So, while the market was falling, the modeled index was invested in treasuries which preserved capital and avoided losses as shown in Exhibit 3.
The length of the largest drawdown for the modeled Risk-Managed Momentum Index was 29 trading days. In contrast, the Syntax US Large Cap Index drawdown lasted 517 trading days.
Finally, the backtested Risk-Managed Momentum Index took 140 trading days to recover the losses associated with its largest drawdown, compared to 1,619 days for the benchmark. .
Conclusion
Studies have shown that momentum strategies have earned a market risk premium throughout the history of US public equity markets. While momentum can be an attractive strategy, it is not without risks. Research has shown that momentum strategies struggle and are likely to underperform in long-lasting bear markets. The DF Risk-Managed Momentum Index was constructed to capture the benefits of momentum while incorporating a tactical overlay to help mitigate the risks associated with extended bear markets. Additionally, the index construction approach seeks to add diversification benefits tied to:
- A positive cash flow screen to help sift out speculative companies.
- Sector neutrality with its US large cap benchmark.
- Mitigating individual security risk (as found in market weight large cap indices like the Syntax LargeCap 500, S&P 500, and Russell 1000) by holding fifty at an equal weight of 2.0% each.
While no one knows what return environments will occur in the future, an investment in a market cap weighted strategy like the S&P 500 will rise and fall with the markets, and the timing and severity of downturns will create varying degrees of angst for investors and their ability to reach their retirement goals. The S&P 500 has been on a remarkable run, producing annualized returns of 16.85% and 12.98% over the past 5 and 10 years, respectively. Investors’ returns have exceeded expectations; however, as we write this paper in March 2025, the market trend has turned negative. After peaking in the middle of February, the market has sold off and the S&P 500 is nearing correction territory based on concerns tied to the geopolitical environment and economic growth.
Where we go from here is uncertain, but there is some sentiment that returns over the next 10 years will be diminished relative to recent history. Vanguard’s median forecast for U.S. equities is just 3.9% over the next decade.[1] Similarly, the Goldman Sachs U.S. equity 10-year expected return forecast comes in at just 3.0%. The prospect of low returns implies current market valuations are elevated relative to historical norms and may signal increased drawdown risk. We believe the DF Risk-Managed Momentum Index may help alleviate some of the downside risk associated with a potential extended bear market whenever it may arrive. You can learn more about the DF Risk-Managed Momentum Index at www.syntaxdata.com or by emailing sgrieco@syntaxdata.com. To learn more about Donoghue Forlines, email Info@DonoghueForlines.com.
1. What is Momentum Investing? | Definition & Strategies | Finbold
2. Momentum Investing: It Works, But Why? - UCLA Anderson Review
3. Fact, Fiction and Momentum Investing
4. 212 Years of Price Momentum (The World’s Longest Backtest: 1801–2012) December 15, 2013, Christopher C. Geczy, PH.D., Mikhail Samonov, CFA
5. The EMA is an average of returns over a specified time period, weighted more heavily toward more recent results while still considering historical data.
6. The index backtest start date is tied to the availability of fundamental data to calculate the free cash flow filter.
7. All performance throughout this document is gross performance and does not account for fees and expenses associated with managing a portfolio. Net of fee performance is not shown because it is not possible to invest in an index.
Disclaimers
Past performance is no guarantee of future results. All performance presented prior to the index inception date is backtested performance. The inception date of the DF Momentum Index was December 17, 2024. The inception date of the DF Risk-Managed Momentum Index was January 2, 2025. The inception date of the Syntax US LargeCap 500 Index was March 14, 2023. Backtested performance is not actual performance but is hypothetical and is suitable only for institutional audiences. Backtested performance may not be predictive of actual or future performance. Backtested data may reflect the application of the index methodology with the benefit of hindsight, and the historic calculations of an index may change from month to month based on revisions to the underlying economic and/or financial data used in the calculation of the index. Charts and graphs are provided for illustrative purposes only. S&P® is a registered trademark of S&P Global and/or its affiliates. Syntax® is a registered trademark of Syntax, LLC and/or its affiliates.
The DF Momentum Index and DF Risk-Managed Momentum Index (the “Indices”) are the property of Donoghue Forlines LLC. Syntax LLC is the administrator of the Indices. Funds or portfolios tracking the Indices are not sponsored by Syntax LLC or its third-party licensors. The Syntax US LargeCap 500 Index is the property of Syntax LLC, which is the administrator of the index.
The results shown do not represent the results of actual trading using client assets but were achieved by means of the retroactive application of an investment process that was designed with the benefit of hindsight, otherwise known as back-testing. Thus, the performance results noted above should not be considered indicative of the skill of the advisor or its investment professionals. The back-tested performance was compiled after the end of the period depicted and does not represent the actual investment decisions of the advisor. These results do not reflect the effect of material economic and market factors on decision making. In addition, back-tested performance results do not involve financial risk, and no hypothetical trading record can completely account for the impact of financial risks associated with actual investing.
Index performance does not represent actual fund or portfolio performance, and such performance does not reflect the actual investment experience of any investor. An investor cannot invest directly in an index. In addition, the results actual investors might have achieved also would have differed from those shown because of differences in the timing, amounts of their investments, and fees and expenses associated with an investment in a portfolio invested in accordance with an index. The indices portrayed herein do not charge management fees directly to end investors or incur brokerage expenses, and no such fees, implementation costs or expenses were deducted from the performance shown; provided, however, that the returns of any investment portfolio invested in accordance with such indices would be net of such fees, implementation costs and expenses. Additionally, none of these indices lend securities, and no revenues from securities lending were added to the performance shown.
This research report is for informational purposes only and is not intended to be, nor should it be construed or used as an offer to sell, or a solicitation of any offer to buy, any security or investment vehicle, nor should it be redistributed. Additionally, the information herein is not intended to provide, and should not be relied upon for, legal advice, tax advice, financial advice, or investment advice. You should make an independent investigation of the matters described herein, including consulting your own advisors on the matters discussed herein. In addition, certain information contained in this research document has been obtained from published and non-published sources prepared by other parties, which in certain cases have not been updated through the date hereof. While such information is believed to be reliable for the purpose used herein, such information has not been independently verified by Syntax and Syntax does not assume any responsibility for the accuracy or completeness of such information. Syntax LLC, its affiliates and their independent providers are not liable for any informational or technical errors, incompleteness, or delays, or for any actions taken in reliance on information contained herein. This document and the information it contains should not be reproduced, redistributed, or used without the prior written consent of Syntax LLC. Distribution of Syntax data and the use of Syntax indices, data, software, or technology to create financial products require a license with Syntax and/or its licensors. Investments are not FDIC insured, may lose value and have no bank guarantee.