

Syntax Direct℠
Artificial Intelligence Index Case Study
Key takeaways:
- Artificial intelligence technology is advancing at an extraordinary pace, presenting transformative opportunities across industries and capturing strong investor interest.
- Over the past 5 years, the Syntax Artificial Intelligence Index Model detailed in this case study has returned 18.9% per year in a backtest, outperforming the broad US benchmark Syntax 3000 by over 380 basis points.
- Syntax Direct℠ allows users to quickly create direct indexing solutions, including thematic indices that provide targeted exposure to innovative concepts like artificial intelligence.
Artificial intelligence (AI) has rapidly emerged as a compelling financial opportunity. As AI technologies advance at an unprecedented pace, proponents are excited by its potential to transform virtually every industry, from healthcare to logistics to insurance to manufacturing. The demand for AI technology from all corners of the economy has spurred massive growth in the many firms developing hardware, software, and services to support this work, with governments and corporations alike pouring billions into AI research and infrastructure. Correspondingly, AI has become an attractive strategic theme in investment portfolios, making it a focal point for those seeking high-growth, future-oriented opportunities.
Syntax Direct℠ allows users to design and maintain indices customized to particular views, including focused thematic indices in fields like AI. Syntax Direct supports a range of different index objectives, from broad-based benchmarks to factors, themes, and impact-focused indices. For this case study, we are going to use the Micro Themes option to create an Artificial Intelligence Index, the characteristics of which are displayed in Exhibit 1.
Exhibit 1: AI Index Model Characteristics and Assumptions

The index model was constructed using a rules-based methodology from the universe of domestic stocks in the Syntax US 3000 Index (SY3000), a broad market US index which has properties and characteristics comparable to other US broad market indices. For each constituent in the Syntax 3000 benchmark, we calculate an “artificial intelligence theme score” based on both the percentage and absolute dollars of revenue a company earns from business activities related to AI, detailed below. For this index, we use a “low” conviction level, which places more emphasis on the dollars of revenue a company earns from AI rather than the percent of revenue. This helps balance the exposure to more pure-play companies like Klaviyo while also including large, multi-product line companies like NVIDIA. The Artificial Intelligence Index model then selects the top 20 companies by score and weights them proportionally to their Artificial Intelligence theme score.
The Artificial Intelligence Theme is focused on the following business segments: AI Hardware, AI Services, and AI Software, with the latter further divided by software for particular industries, including healthcare, transportation and logistics, search, finance and insurance, sales and marketing, voice recognition, visualization and design, and security, as well as diversified AI software.
Syntax’s approach to classifying companies identifies revenues at the product line level, allocating companies to multiple sectors and industries based on how much revenue they earn from them. With this level of granularity comes the ability to be more precise when constructing an index, pinpointing how much revenue each company generates from a specific theme.
The Artificial Intelligence Index model does not target specific sector and sub-sector weights. Rather, these weights, which are shown in Exhibit 2, reflect the companies with the highest AI theme scores.
Exhibit 2: Artificial Intelligence Index Sector & Sub-Sector Weights

As modeled, the Artificial Intelligence Index has allocations to five sectors and six sub-sectors and is heavily concentrated in Technology, which represents 76% of the index. The Technology allocations represent the bulk of the AI industry, comprising hardware and software companies developing AI tools. Allocations in the remaining sectors are more focused on services and industry applications of AI technology.
Exhibit 3 shows the weights to the top 10 constituents, which include companies engaged in a range of AI-related activities. As this index is modified equal weight, weighting proportional to theme score, constituent weights currently range from 5.4% (NVIDIA) to 4.7% (Cognex) for the 20 securities in the index. This approach seeks to mitigate the risk tied to an individual security.
Exhibit 3: Artificial Intelligence Index Top 10 Holdings

Syntax Direct calculates backtests for indices modeled on the platform beginning on December 15, 2017. Exhibit 4 shows the results of this backtest through April 30, 2025 against the Syntax 3000 benchmark. With its market cap-weighted exposure to the Magnificent Seven, the benchmark has exhibited very strong performance: a hypothetical $1,000 investment grew to $2,252, an annualized return of 12.2%.
Exhibit 4: Syntax Artificial Intelligence Index Modeled vs. Syntax 3000 Index
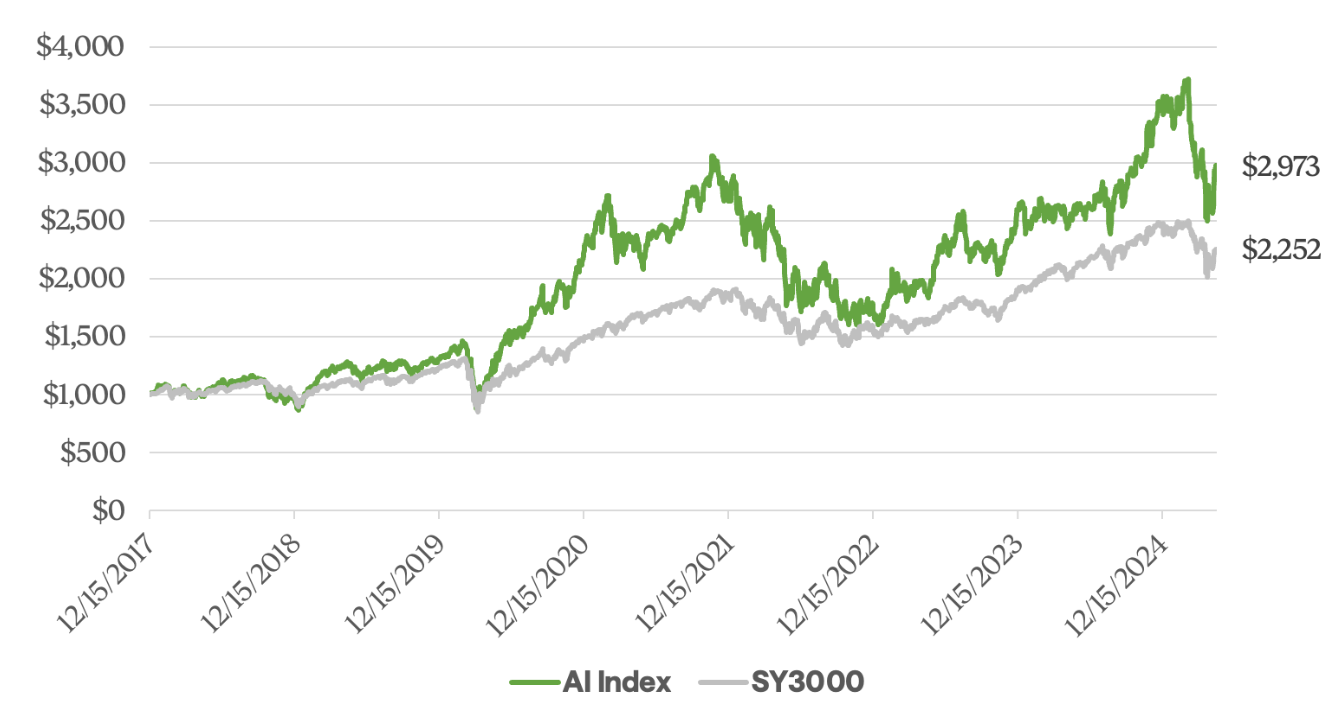
Over the backtest period, the Syntax Artificial Intelligence Index model grew the same hypothetical $1,000 investment to $2,973, an annualized return of 16.7%. Unsurprisingly, the AI index saw massive modeled growth beginning in the middle of 2020, as the pandemic recovery trade benefited many technology companies investing in AI. 2022 saw poor modeled performance, with drawdowns of nearly 49% from the peak on November 4, 2021 to November 9, 2022. However, with the public release of ChatGPT in November 2022, AI investing took off once more, growing 137% over the next two and a quarter years in the backtest until the recent market peak in February 2025. While recent geopolitical turbulence has hit the market hard, and AI stocks especially so, which also likely were affected by concerns about low-cost AI models, performance in the second half of April 2025 has stemmed the tide for the time being. This journey highlights that investing in themes like AI can be a volatile experience: the AI index model’s annualized standard deviation over the backtest period was 31.3%, versus 20.1% for the Syntax 3000 index and has a beta of 1.31 over the same period.
Exhibit 5 compares index fundamentals for the Artificial Intelligence Index against the Syntax 3000 benchmark. As expected for a growth-oriented theme like AI, the index model’s dividend yield is negligible at just 0.17%, a fraction of the benchmark’s 1.28% yield. Its price / earnings ratio is a shocking 594.9, a strong indication of the massive enthusiasm the market has for AI’s potential growth. Included in this calculation are six constituents whose earnings were negative, inflating the ratio considerably. The AI index holds both massive companies like NVIDIA as well as small cap names like Taboola, but has an average market capitalization lower than the overall market.
Exhibit 5: Index Fundamentals: Syntax Artificial Intelligence Index and Syntax 3000 Index

In this case study, we highlight how an advisor can use Syntax Direct to create a custom index solution for a client looking to invest in the artificial intelligence space. We demonstrate the steps taken to create the custom Artificial Intelligence Index and illustrate the information that is readily available in Syntax Direct to support our sample case study. In addition to enabling the creation of personalized index solutions, Syntax Direct supports the reporting and regulatory needs of advisors by providing immediate access to both factsheets and index rulebooks, compliance-ready documents that detail the key methodologies used to create and backtest each index. To learn more, please visit www.syntaxdata.com or email sgrieco@syntaxdata.com.