

STRATIFIED LARGECAP Q1 2025 REVIEW
Executive Summary
- The Stratified LargeCap Index (SYLC) returned 0.2% in Q1 2025 vs. -4.3% for the S&P 500. SYLC’s outperformance of 450 basis points was driven by its balanced sector exposure and modest allocations to the Magnificent Seven relative to the S&P 500.
- Five of the Magnificent Seven stocks lost 10% or more in Q1; the three largest were Tesla (-36%), Nvidia (-20%) and Alphabet (-18%).
- SYLC particularly benefited from its enhanced diversification in three sectors: the Consumer sector returned -5.2%, outperforming the S&P 500 by 930 basis points. Information (+0.4%) and Information Tools (-8.6%) exceeded the S&P 500 by 540 and 420 basis points, respectively.
- For the past year ending March 31st, the S&P 500 returned 8.3%, exceeding the 5.3% return of SYLC. The one year result of the S&P 500 as of December 31st was 25.0%; the precipitous decline in the one year performance is tied to the 10.6% return in Q1 2024 being replaced by the -4.3% return in Q1 2025.
Domestic Equity Market Performance Summary
Exhibit 1 shows Q1 was a difficult quarter for the cap-weighted domestic indices. The S&P 500 (-4.3%), S&P MidCap 400 (-6.1%), and S&P SmallCap 600 (-8.9%) all suffered losses, as well as the S&P 500 Growth index (-8.5%). Stratified LargeCap (+0.2%) and the S&P 500 Value (+0.3%) posted modest positive returns. The one-year results show the S&P 500's 8.3% return outperformed SYLC by three percentage points. The S&P MidCap (-2.7%) and SmallCap (-3.4%) indices posted losses for the year. Interestingly, the S&P 500 Value Index had the highest three-year return of any of the benchmarks, driven in part by its strong performance in the down market of 2022. Over the past five years, the results of SYLC (+18.3%) and the S&P 500 (+18.6) are very similar, and all of the indices in Exhibit 1 enjoyed very strong absolute annualized returns of at least 15%.
Exhibit 1: Domestic Equity Market Performance Summary (%)

Q1 2025 started bullish but ended bearish. While the S&P 500 reached a record closing high on February 19th, the tide started to turn with the release of the DeepSeek R1 reasoning model which achieved its results with a fraction of the cost and computing power of its competitors1. This placed pressure on Nvidia (-20%) and other tech/AI related stocks. In a change from recent trends, the Magnificent Seven were a drag on performance as five of the members were down 10% of more. Nvidia was joined by Tesla (-36%), Alphabet (-18%), Microsoft (-12%), and Amazon (-10%). The Trump Administration's focus on trade policy and the use of tariffs to address trade deficits and boost US manufacturing created uncertainty in the global markets. Trade tensions escalated during the quarter as new and/or additional tariffs were applied to China, Mexico, Canada and other countries, including on imports of steel, aluminum, and automobiles.
Exhibit 2: Stratified LargeCap (SYLC) and S&P 500 Sector Allocation

Comments: SYLC vs. S&P 500
- All SYLC sectors (shaded in gray) have a target weight of 12.5% to provide balanced exposure to business risks.
- Relative to SYLC, the S&P 500's 28.4% weight to Information Tools represents an overweight of 16.3 percentage points to this sector.
- The S&P 500's weight to the Information sector is 9.5 percentage points higher than SYLC, driven by the index’s 12.2% weight to the Internet Services and Website sub-sector (e.g., Alphabet, Amazon and Meta Platforms).
- SYLC has significant over-weights to the Consumer (6.8%), Energy (6.5%), and Food (7.2%) sectors, all of which are under-represented in the S&P 500 Index.
The goal of the Stratified LargeCap Index is to deliver an unbiased return that is representative of all the business opportunities in the market, not just the largest ones. The index holds the exact same stocks as the S&P 500; the only difference is the weighting scheme, which is designed to reduce concentration risk to both individual stocks and sectors. Exhibit 3 looks at the performance of Stratified LargeCap relative to the S&P 500 by Syntax’s eight primary sectors. Energy, Healthcare and Food were the strongest performing sectors within both SYLC and the S&P 500. The relatively favorable results of SYLC to the S&P 500 were driven largely by its outperformance in three sectors.
- Consumer Products and Services was down 14.5% in the S&P 500, underperforming SYLC by 930 basis points, which benefited from a lower exposure to Tesla.
- Information Tools, which includes NVIDIA, was down 12.8%, trailing SYLC by 420 basis points.
- The Information sector, which includes Alphabet and Amazon, returned -5.0% in the S&P 500, compared to the +0.4% return in SYLC.
Exhibit 3: Stratified LargeCap (SYLC) and S&P 500 Q3 2024 Performance by Sector
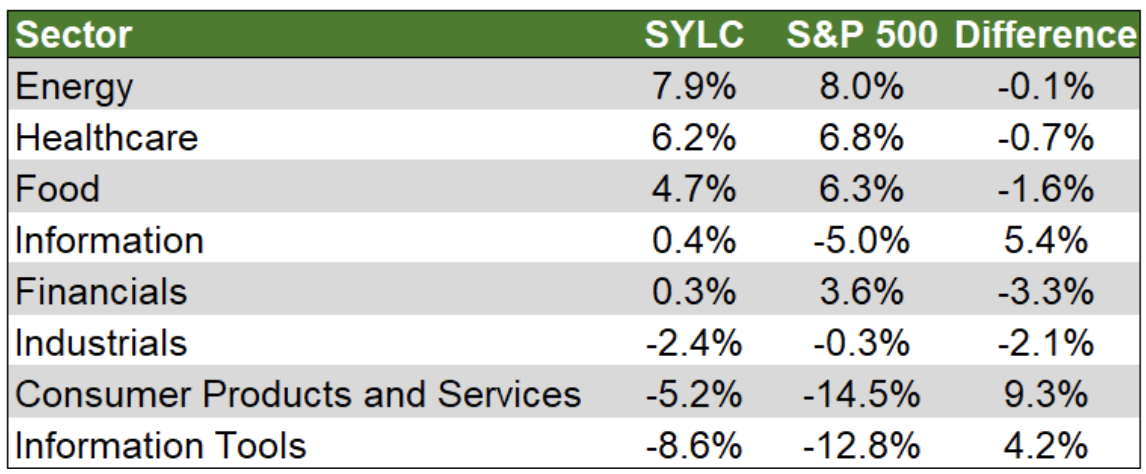
Exhibit 4 displays the results for the 24 sub-sectors in Syntax’s FIS® industry classification system. Viewing results at this more granular level provides insights into the industries and companies that drove performance for the past quarter.
In total, 11 of the 24 sub-sectors in SYLC produced positive results in Q1 compared to 12 for the S&P 500. SYLC provided better downside protection as just two of its sub-sectors produced returns less than 10%, compared to five for the S&P 500, which we attribute to the importance of diversification within sectors. Highlights include:
- Consumer Healthcare was the best performing sub-sector within SYLC, returning 17.4%, outperforming the S&P 500 by 620 basis points. SYLC benefited from its much higher weight to CVS which was up 53% during the quarter.
- Insurance (+9.5%) and Oil and Gas (+9.1%) were the second and third best performing sectors for SYLC, these both underperformed their S&P counterparts by 460 and 110 basis points, respectively.
- The greatest area of outperformance for SYLC was in the Transportation sub-sector, which outperformed by roughly 20 percentage points. The sub-sector returned -6.9% compared to -27.0% for the S&P 500, which was dragged down by Tesla.
- Similarly, SYLC posted weak absolute performance and strong relative performance in the Integrated Circuits sub-sector, its return of -11.7% exceed the -17.4% return realized by the S&P 500. Balanced exposure to this sub-sector helped relative to the concentrated exposure in Nvidia found in the S&P 500.
Exhibit 4: Stratified LargeCap and S&P 500 Q1 2025 Performance by Sub-Sector

The Uncertain Road Ahead
We wrote the following in May of 2022 addressing the (then) current political state of the world, which included Russia’s invasion of Ukraine, inflation running at over eight percent per year, continued supply chain challenges, and the lingering impacts of the Pandemic:
“Macroeconomic uncertainty is at a high-level creating challenges for how to position portfolios. What has unfolded over the past six months highlights the events that will drive portfolio success in the future are not knowable today.”
The facts and circumstances have changed since 2022, but the uncertainty surrounding the market has returned. Exhibit 5 highlights the daily results of the CBOE Volatility Index. Volatility increased during the course of the first quarter, but it spiked dramatically on April 3rd while retreating some on April 9th as a 90-day pause was put in place for most tariffs.2
Exhibit 5: CBOE Volatility Index: VIX (VIXCLS)

The market’s normal ebbs and flows will likely continue to be magnified over the next 90 days as news on trade agreements ping pong between favorable progress and setbacks.
Conclusion
The world can change quickly, and so can returns. Just a quarter ago, it was easy to admire the 25% one-year return of the S&P 500 as of December 31st. The trailing one-year return as of March 31st decreased to 8.3%, the results of the 10.6% return in Q1 2024 being replaced by a -4.3% return in Q1 2025. As we noted in 2022 and restate today, it is hard to know how well a portfolio is positioned relative to a set of events that are not knowable today. In these times of elevated uncertainty, we believe it is important for investors to seek balance and diversification in their portfolios. The Stratified LargeCap Index, designed to diversify across all types of businesses in the S&P 500 universe, would have benefited investors during Q1 when its 0.2% return, while modest, outperformed the S&P 500 by 450 basis points. Similarly, when tech stocks led the market down in 2022, Stratified LargeCap’s return of -8.8% outperformed the -18.1% return of the S&P 500 by 930 basis points.
There is, of course, no guarantee that Stratified LargeCap will outperform in down markets. But as the present administration tries to rewrite the rules of global trade, with the results to be determined for better or for worse, we believe having an allocation to the Stratified LargeCap Index and its balanced approach to the business risks embedded in large-cap US stocks makes intuitive sense in an uncertain world.
1. https://www.sciencealert.com/deepseek-is-sending-shockwaves-around-the-world-heres-why
2. https://www.usnews.com/news/economy/articles/2025-04-09/trump-liberates-markets-with-90-day-pause-on-most-tariffs-except-for-china
About Syntax
Syntax LLC is a financial data and technology company that codifies business models. Syntax operates through three segments: Company Data, Wealth Technology, and Financial Indices. Using its patented FIS® technology inspired by systems sciences, the Company Data segment offers the most comprehensive, granular, and accurate product line revenue data available on the market. The Wealth Technology segment then uses this abundance of data to facilitate the instantaneous creation and ongoing management of direct indexing solutions and rules-based equity portfolios through a fully automated platform. The Financial Indices segment enables Syntax to deliver customized and proprietary indices, including core global benchmarks and micro- and macro-thematic, smart beta, defined outcome, and target volatility indices. These indices are foundational for a range of financial products, such as ETFs, UITs, and structured products. Learn more at www.syntaxdata.com.
Important Disclaimers
This document is for informational purposes only and is not intended to be, nor should it be construed or used as an offer to sell, or a solicitation of any offer to buy, any security. Additionally, the information herein is not intended to provide, and should not be relied upon for, legal advice or investment recommendations. You should make an independent investigation of the matters described herein, including consulting your own advisors on the matters discussed herein. In addition, certain information contained in this informational piece has been obtained from published and non-published sources prepared by other parties, which in certain cases have not been updated through the date hereof. While such information is believed to be reliable for the purpose used in this informational piece, such information has not been independently verified by Syntax and Syntax does not assume any responsibility for the accuracy or completeness of such information. Syntax LLC, its affiliates and their independent providers are not liable for any informational errors, incompleteness, or delays, or for any actions taken in reliance on information contained herein. Charts and graphs are provided for illustrative purposes only. Syntax®, Affinity® and Locus® are trademarks or registered trademarks of Syntax, LLC and its affiliate Locus LP.
Index performance does not represent actual fund or portfolio performance and such performance does not reflect the actual investment experience of any investor. An investor cannot invest directly in an index. In addition, the results actual investors might have achieved would have differed from those shown because of differences in the timing, amounts of their investments, and fees and expenses associated with an investment in a portfolio invested in accordance with an index. None of the Syntax Indices or the benchmark indices portrayed herein charge management fees or incur brokerage expenses, and no such fees or expenses were deducted from the performance shown; provided, however, that the returns of any investment portfolio invested in accordance with such indices would be net of such fees and expenses. Additionally, none of such indices lend securities, and no revenues from securities lending were added to the performance shown. Benchmark data for the S&P 500 is provided by S&P Dow Jones Indices. Past performance is no guarantee of future results. Charts and graphs are provided for illustrative purposes only.
The Syntax Stratified LargeCap Index (“the Index”) is the property of Syntax, LLC, which has contracted with S&P Opco, LLC (a subsidiary of S&P Dow Jones Indices LLC) to calculate and maintain the Index. The Index is not sponsored by S&P Dow Jones Indices or its affiliates or its third-party licensors (collectively, “S&P Dow Jones Indices”). S&P Dow Jones Indices will not be liable for any errors or omissions in calculating the Index. “Calculated by S&P Dow Jones Indices” and the related stylized mark(s) are service marks of S&P Dow Jones Indices and have been licensed for use by Syntax, LLC. S&P® is a registered trademark of Standard & Poor's Financial Services LLC (“SPFS"), and Dow Jones® is a registered trademark of Dow Jones Trademark Holdings LLC (“Dow Jones”). Syntax®, Stratified®, Stratified Indices®, Stratified Weight™, and Locus® are trademarks or registered trademarks of Syntax, LLC or its affiliate.
This report is for informational purposes only and is not intended to be, nor should it be construed or used as an offer to sell, or a solicitation of any offer to buy, any security. Additionally, the information herein is not intended to provide, and should not be relied upon for, legal advice or investment recommendations. You should make an independent investigation of the matters described herein, including consulting your own advisors on the matters discussed herein. In addition, certain information contained in this presentation has been obtained from published and non-published sources prepared by other parties, which in certain cases have not been updated through the date hereof. While such information is believed to be reliable for the purpose used in this presentation, such information has not been independently verified by Syntax and Syntax does not assume any responsibility for the accuracy or completeness of such information. Syntax LLC, its affiliates and their independent providers are not liable for any informational errors, incompleteness, or delays, or for any actions taken in reliance on information contained herein.
This report and the information herein may not be reproduced (in whole or in part), distributed or transmitted to any other person without the prior written consent of Syntax. Distribution of Syntax data and the use of Syntax indices to create financial products requires a license with Syntax and/or its licensors. Investments are not FDIC insured, may lose value and have no bank guarantee.