

The Syntax Space Industry Index (SYSPX)
Key Takeaways
- The global space economy now exceeds $600 billion, supported by satellite-enabled communications, navigation, earth observation, national security, and data services.
- Public-market access is harder than the headline opportunity suggests. Many space activities are embedded inside diversified aerospace and defense companies, while newer pure-plays can be volatile and event-driven.
- The Syntax Space Industry Index is designed as a rules-based pure-play expression of the U.S.-listed space theme: revenue-based eligibility, liquidity and tradability screens, quarterly review, and equal weighting.
The Space Economy Has Become Operating Infrastructure
For most of its history, space exploration was the domain of governments, an era when rockets were national programs, satellites were strategic assets, and the space economy ran largely as an extension of public budgets. Today that model has given way, and space reaches into ordinary life whenever a phone finds its location, a weather forecast updates, a crop yield is estimated from orbit, or a video call crosses an ocean.
The space economy has crossed $600 billion and is on a trajectory toward $1 trillion. Novaspace estimates the global space economy reached $626.4 billion in 2025 and could expand to $1.01 trillion by 2034, a 5.5% compound annual growth rate.1
The Space Foundation measured the 2024 space economy at a record $613 billion, up 7.8% from the prior year, with commercial activity representing 78% of the total.2 WEF and McKinsey take a broader view of space-enabled economic activity and estimate a potential $1.8 trillion opportunity by 2035.3
Reusable rockets and competition among launch providers have lowered the cost and increased the frequency of access to orbit. The world attempted 329 orbital launches in 2025, with 321 reaching orbit or near-orbit, according to data compiled by Jonathan McDowell and reported by Payload. ESA statistics updated in April 2026 estimate that about 15,200 satellites are still functioning in Earth orbit.4
Space assets are increasingly treated as critical infrastructure for communications, missile warning, navigation, geospatial intelligence, and space-domain awareness, making the commercial space opportunity not simply a consumer or broadband story but one tied to national-security budgets and resilient infrastructure.
Private funding has recovered from the 2022–2023 market reset, when rising interest rates triggered a broad pullback in new investment. Since then, publicly traded space pure-plays have experienced large, sometimes abrupt moves as milestones turned into revenue opportunities. Space Capital reported that investment in space infrastructure reached a record $22.2 billion in 20255, while Seraphim Space reported record quarterly global space investment in Q3 2025 and another record in Q1 20266. The public-market milestone came in the final weeks of this performance window, when SpaceX priced its IPO on June 11, 2026, began trading on June 12 under ticker SPCX, and completed the offering on June 15 after the underwriters exercised the full overallotment option.
Why the Space Theme Needs an Index
The size of the space economy does not translate directly into investable opportunity, and practically, there are challenges that stand between the theme and genuine investment exposure to it.
Many listed companies with space operations are diversified aerospace and defense businesses, where satellites, launch systems, or space electronics represent only one revenue line intertwined with a mix of aircraft, missiles, defense electronics, or government services. The space theme can be buried even when the company is active in space, and a broad sector allocation will likely capture far more defense and aviation revenue than space revenue.
This challenge is compounded by the fast-paced evolution of the investable universe. For example, SpaceX was private for nearly all of the September 20, 2024 to June 30, 2026 performance shown below, becoming a newly public company in mid-June 2026. A new public issuer is not automatically added to a rules-based index since it must satisfy the methodology at a scheduled reconstitution, including exposure, liquidity, price, market-capitalization, and option-liquidity screens, and SpaceX entered the index at the June 2026 quarterly reconstitution reflected in the June 30, 2026 holdings snapshot.
Pure-play space companies also carry meaningful single-stock risk. Many are small- or mid-capitalization businesses whose stock prices can hinge on launch outcomes, contract awards, satellite deployments, or customer milestones. The same event-driven volatility that makes them compelling also makes individual names difficult to size. While a rules-based index cannot remove that industry risk, it can help mitigate the risk of on any single launch or any single company.
The Syntax Space Industry Index is designed to address the challenges by defining space exposure through revenue that is a more precise measure than sector labels, screens for investability, and equal-weights the resulting pure-play basket so the index reflects the theme rather than one dominant constituent.
How the Syntax Space Industry Index Is Built
The Syntax Space Industry Index (SYSPX) launched on March 11, 2026 with a backtest history beginning at a starting value of 1,000 on September 20, 2024. The methodology is rules-based and starts with the Syntax US 3000 universe. Within that universe, space companies are identified through Syntax’s proprietary revenue-based classification that maps what companies actually do, not simply their broad sector labels.
Exhibit 1: Syntax Space Industry Index Methodology

Focused Pure-Play Sector Exposure
As of the June 30, 2026 holdings snapshot, taken after the June quarterly reconstitution, the index held 16 companies. The index targets equal weight, with each name representing roughly 6.3% at rebalance.
Exhibit 2: Space Exposure in the Syntax Space Industry Index
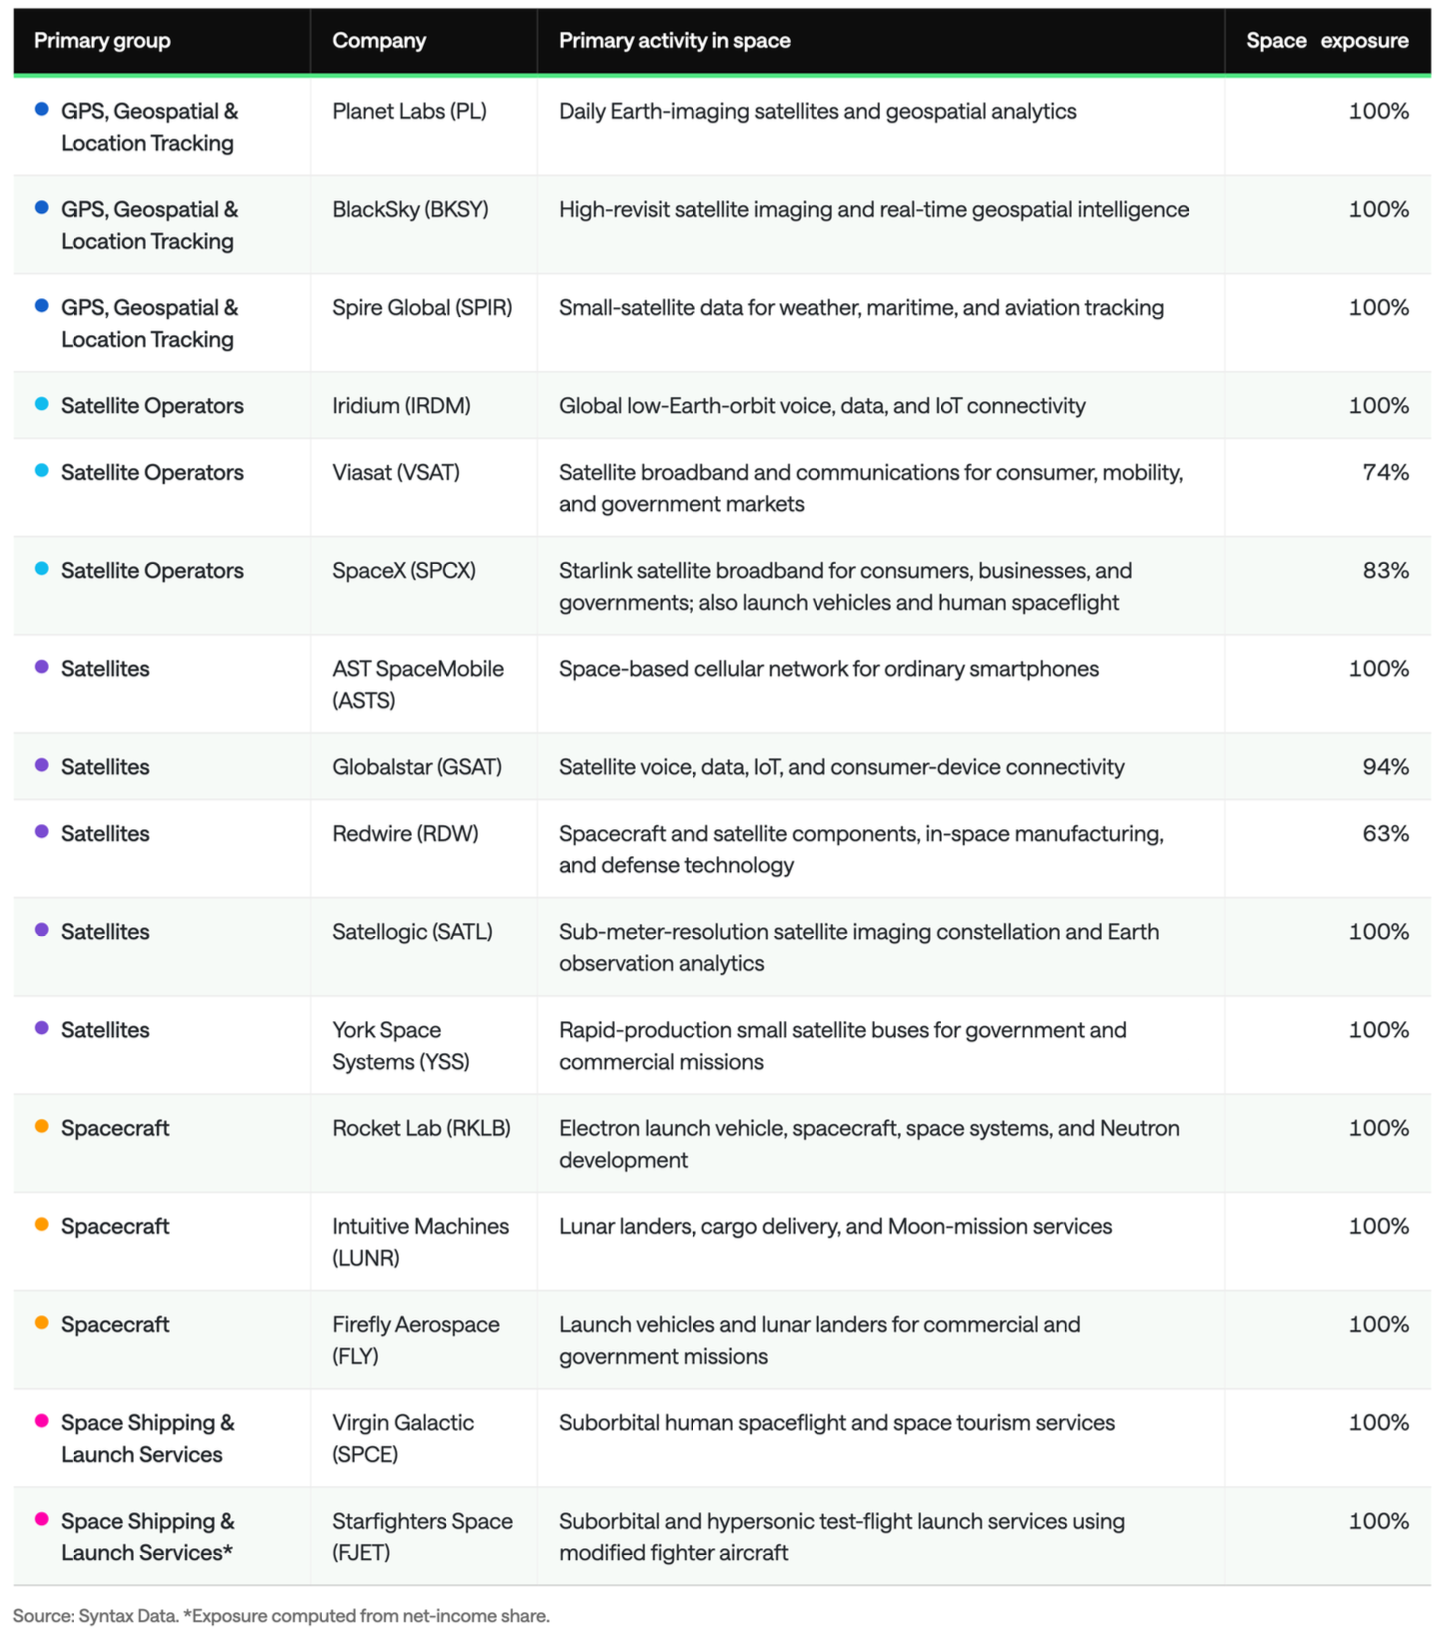
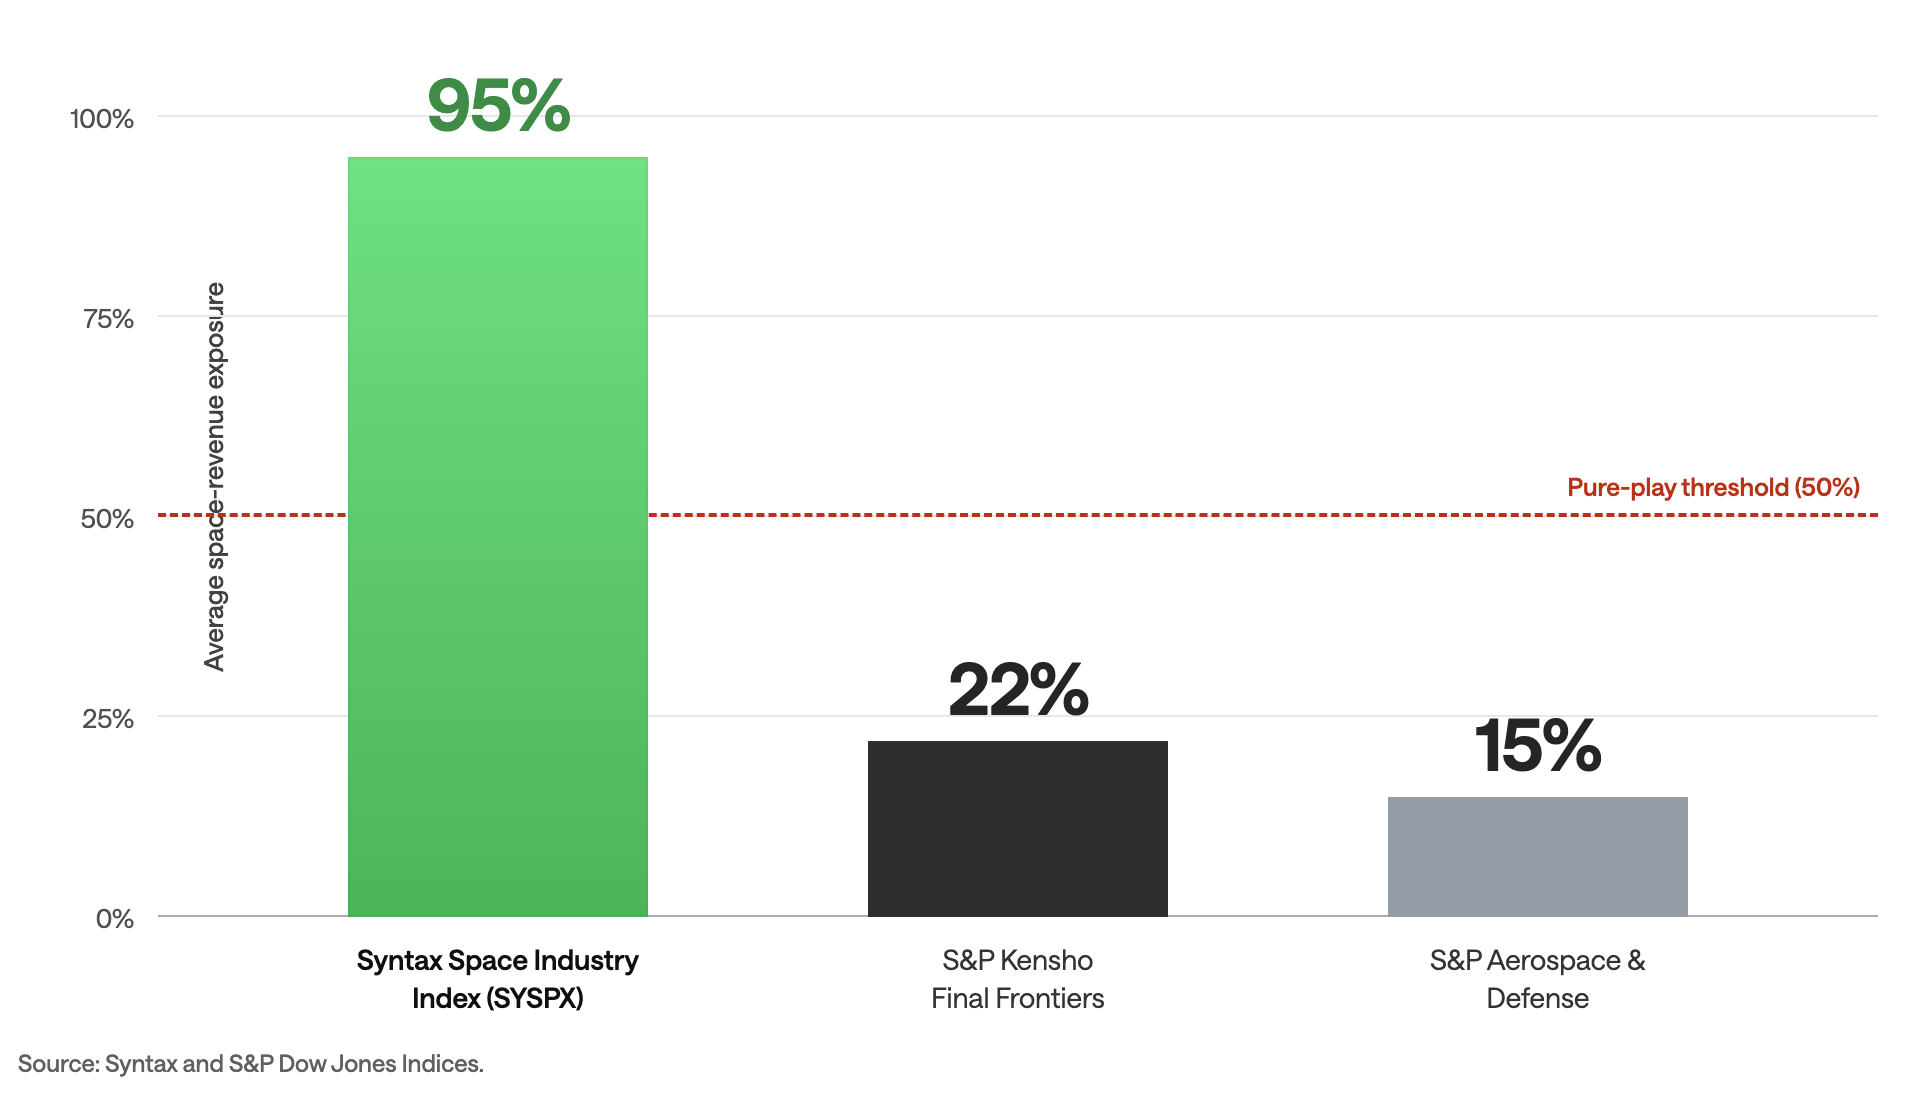
With an average of 95% of revenue derived from space activities under the taxonomy, the 16 constituents are overwhelmingly pure-play businesses, and twelve of the sixteen carry 100% space exposure.
This approach sharply contrasts with two S&P benchmarks, illustrating how quickly the theme dilutes in broader baskets. The S&P Kensho Final Frontiers Index, which spans space and adjacent frontier technologies, averages 22% space revenue across its 37 constituents. The S&P Aerospace & Defense Select Industry Index averages 15% across its 48 constituents, a reflection of how deeply the space revenue of even active participants is buried inside larger defense and aviation businesses.
Exhibit 3: Pure-Play Space Revenue Exposure
Risk and Return in the Space Economy
The modeled performance history for SYSPX began on September 20, 2024 with a starting value of 1,000 and rose to 4,474 through June 30, 2026, a cumulative total return of 347.4%. That 21-month window captured an unusually strong period for commercial-space equities, one that coincided with accelerating launch cadence, record private investment, and the SpaceX IPO.
Both the S&P Aerospace & Defense Select Industry Index and the S&P Kensho Final Frontiers Index trailed the model by a wide margin over the same window, though SYSPX produced those returns with materially higher volatility and drawdowns, as expected for a purer take on an exciting but volatile theme.
Exhibit 4: Syntax Space Industry Index Cumulative Return Reflects Pure-Play Space Strength
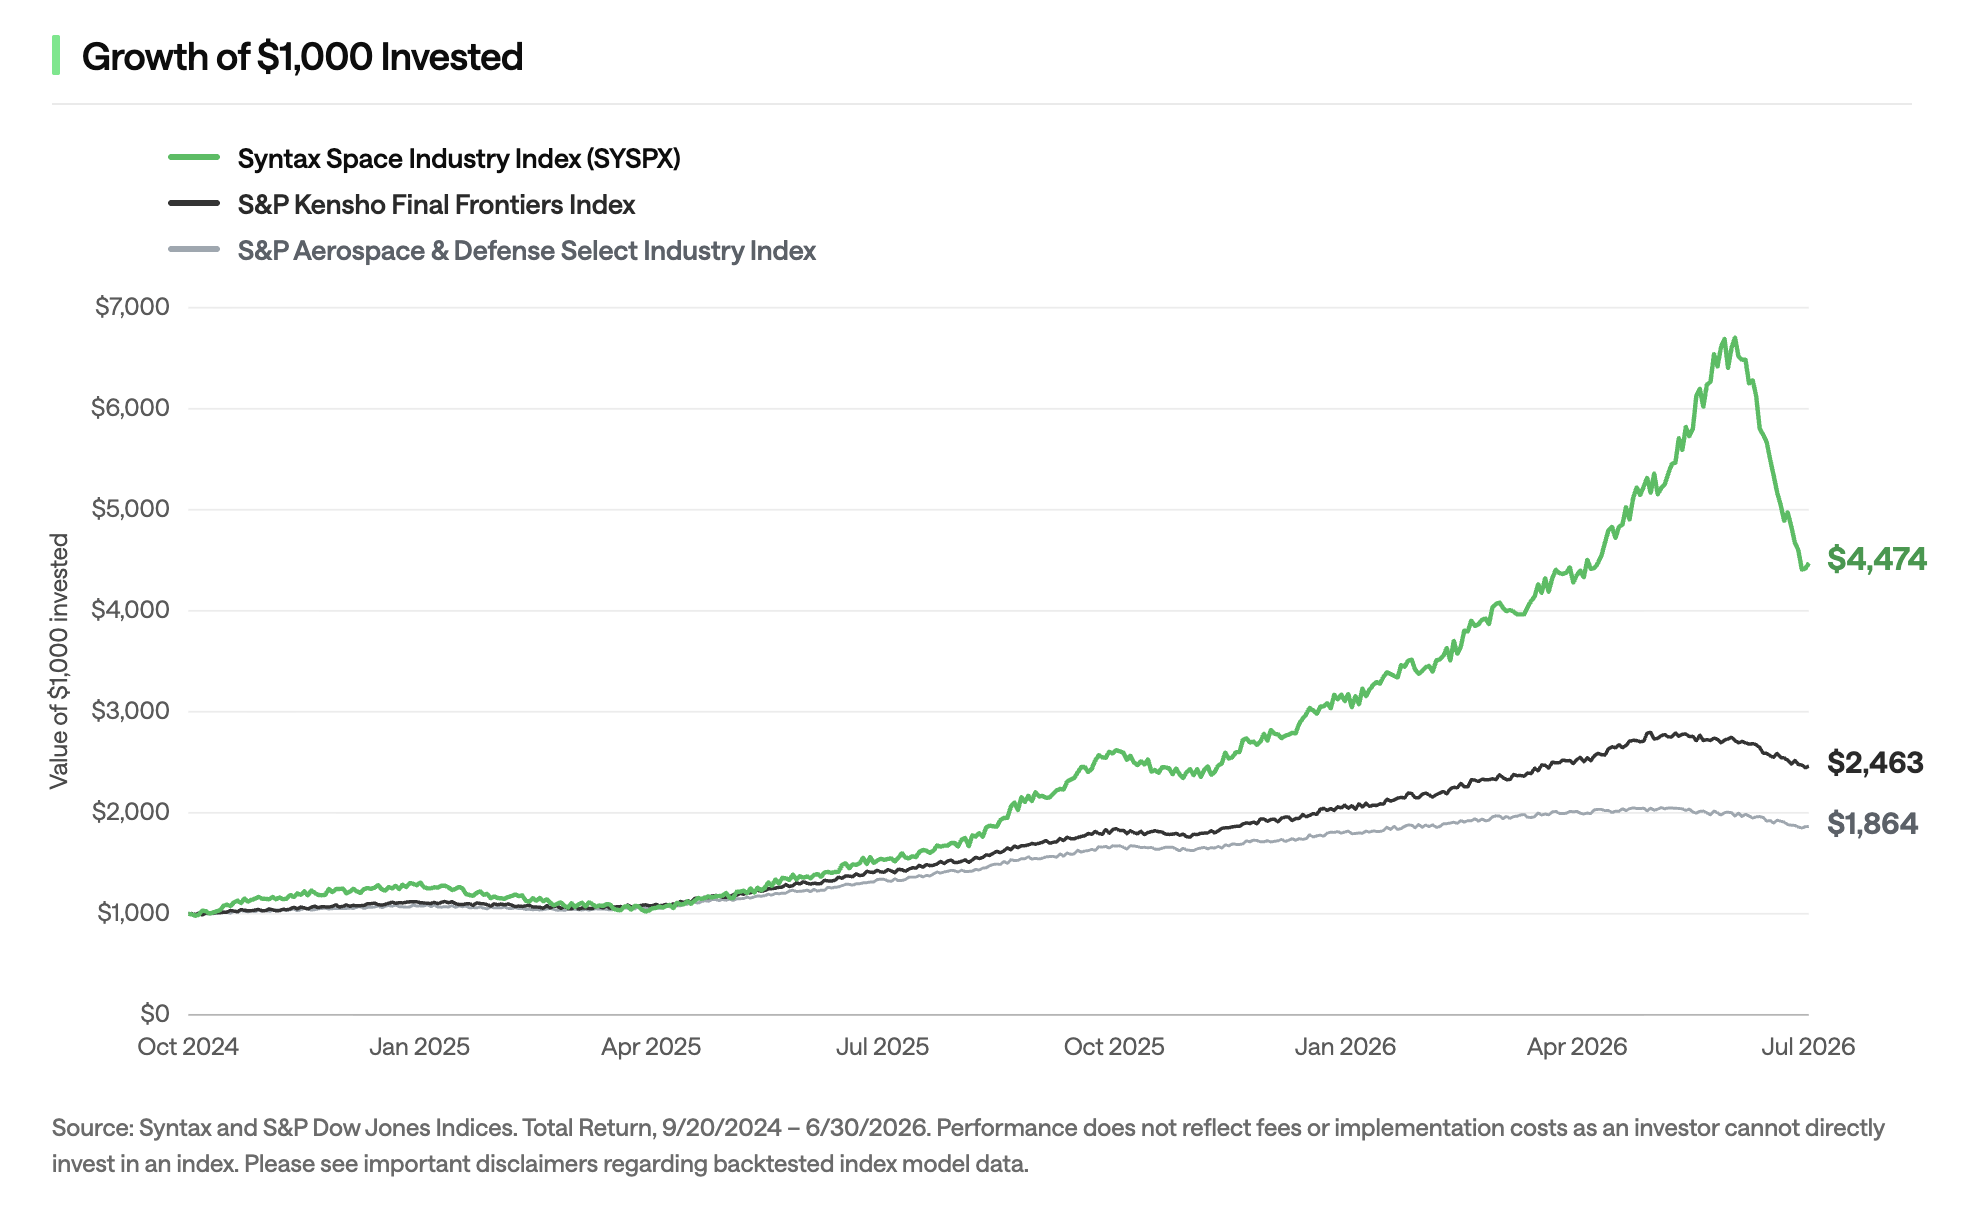
Exhibit 5: Space Economy Index Return and Risk Characteristics
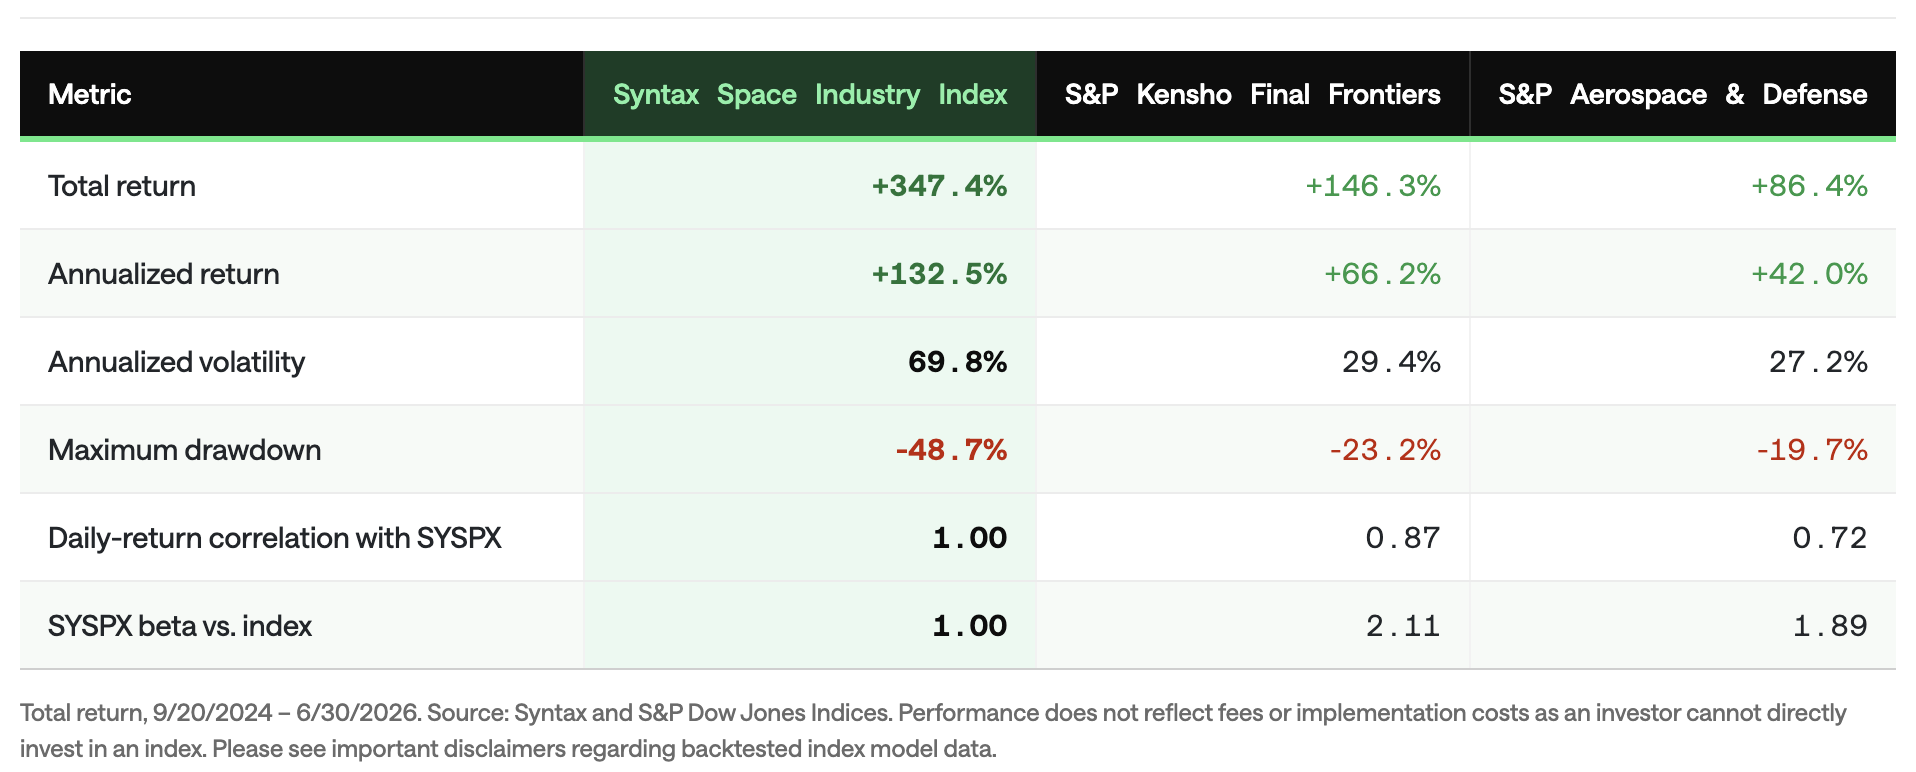
SYSPX behaved as a focused, high-beta thematic basket in the backtest, capturing the sharp rally in commercial-space pure-plays while also absorbing a maximum drawdown of 48.7% and a peak-to-trough decline of about 43% from its May 28, 2026 high. Its correlation of 0.87 with the more space-focused S&P Kensho Final Frontiers index, versus 0.72 with S&P Aerospace & Defense, confirms it is riding the same commercial-space cycle at roughly twice the amplitude. It is a concentrated expression of a young and fast-moving industry, and it behaves like one.
Conclusion
Space has moved from a government program to commercial infrastructure, with satellites, launch services, and space-enabled data now supporting navigation, communications, agriculture, logistics, insurance, and national defense. Public-market access to that growth is uneven, however, because many space businesses are either embedded in diversified companies or concentrated in volatile pure-plays, and a broad sector allocation captures far more defense and aviation revenue than space revenue.
SYSPX addresses that problem by selecting U.S. listed companies according to revenue-based space exposure, applying liquidity and tradability screens, and equal-weighting the resulting pure-play basket as stated in its transparent methodology. For investors who want a disciplined, rules-based expression of the commercial space theme, the index offers a curated way to measure it and serve as the underlying for tracking products.
1. Novaspace, “Global Space Economy Reaches $626 Billion, Marking a New Phase of Growth,” press release, January 28, 2026.
2. Space Foundation, The Space Report 2025 Q2, July 2025.
3. World Economic Forum and McKinsey & Company, Space: The $1.8 Trillion Opportunity for Global Economic Growth, April 2024.
4. Payload, “2025 Orbital Launch Attempts by Country,” January 5, 2026, citing launch statistics compiled by Jonathan McDowell; European Space Agency, Space Environment / DISCOS, “Space Environment Statistics” (satellites in orbit), accessed April 21, 2026.
5. Space Capital, Space Investment Quarterly (Space IQ) series, through Q4 2025.
6. Seraphim Space, Seraphim Space Index reports for Q3 2025 and Q1 2026.