

Key Takeaways
- Small caps offer diversification away from a concentrated mega-cap market, but broad small-cap benchmarks include a meaningful share of unprofitable and highly leveraged companies. Combining value, quality, and price momentum gives advisors a more disciplined way to access the asset class.
- Over the full backtest period (12/15/2017 to 5/31/2026), the Small-Cap Multifactor Index Model returned 11.41% annualized, outperforming the Russell 2000 by 201 basis points per year.
- A hypothetical $1,000 invested at backtest inception grew to $2,492 in the index model versus $2,137 in the benchmark, gross of fees and expenses. That is an additional $355 of cumulative return on the same starting capital.
- The strategy delivered higher risk-adjusted modeled returns: a 5-year Sharpe ratio of 0.35 versus 0.15 for the benchmark, and a modestly shallower maximum drawdown (-40.2% versus -41.8%), while its 0.98 correlation across 500 holdings keeps it recognizable as a core small-cap allocation.
- Syntax Direct lets advisors build, backtest, and deploy this index in minutes, with full control over factor selection, conviction level, sector exposures, and rebalance schedule.
The Advisor Opportunity
After more than a decade of large-cap dominance, many advisor portfolios have become increasingly concentrated in a handful of mega-cap names. Small-cap stocks offer a potential counterbalance, as they are often priced at a meaningful valuation discount to large caps and provide exposure to a more domestically oriented segment of the U.S. equity market. For advisors looking to diversify away from technology-heavy market leadership, small caps are an increasingly relevant place to look.
The challenge is that broad small-cap exposure requires discipline. The Russell 2000 includes a meaningful share of unprofitable and highly leveraged companies. Buying the universe wholesale means owning strong small-cap businesses alongside a long tail of potentially financially fragile names. A multifactor tilt addresses that issue directly.
Each factor answers a different question, and the three are deliberately complementary. Value favors companies trading at reasonable prices relative to book value, sales, and earnings. Quality emphasizes stable, profitable companies with lower leverage and consistent earnings. Price momentum leans the index toward names the market is already rewarding, helping the strategy participate in small-cap rallies rather than relying only on companies that look inexpensive.
Used together at high conviction, these factors target the kind of companies an advisor may want to own: reasonably priced, financially sound, and on an improving trajectory. This case study walks through how an advisor can use Syntax Direct to construct a Value + Quality + Price Momentum tilted small-cap index on the Russell 2000 universe, examines the resulting characteristics, and presents the backtested performance against the broad small-cap benchmark.
Building the Index in Syntax Direct
Syntax Direct organizes index construction around a small set of strategy tiles. For an advisor building a tilted small-cap core portfolio, the Core tile is the appropriate starting point. The Core strategy reduces the number of holdings in a chosen benchmark while preserving its overall character, then applies any selected factor tilts on top. Exhibit 1 summarizes the design choices used in this case study.
Exhibit 1: Index Characteristics and Assumptions

The starting universe is the Russell 2000, the broad U.S. small-cap benchmark. From this universe, the Core methodology selects 500 holdings, weighted by modified market capitalization. Syntax Direct then applies a multifactor combined tilt using the Value, Quality, and Price Momentum factors at high conviction. Under the combined methodology, each company receives an averaged score across the three factors, so companies that score well across the blend are more aggressively up-weighted while companies that score poorly are down-weighted, with the degree of tilt applied within each sector. The index model reconstitutes annually and rebalances quarterly, helping factor exposures stay current without driving excessive turnover.
Sector Exposures
The multifactor tilt produces sector allocations that differ from the broad benchmark, reflecting where high-scoring companies happen to concentrate. Exhibit 2 compares the sector weights of the tilted index model against the Russell 2000 as of the most recent rebalance.
Exhibit 2: SectorAllocations vs. Russell 2000 Benchmark
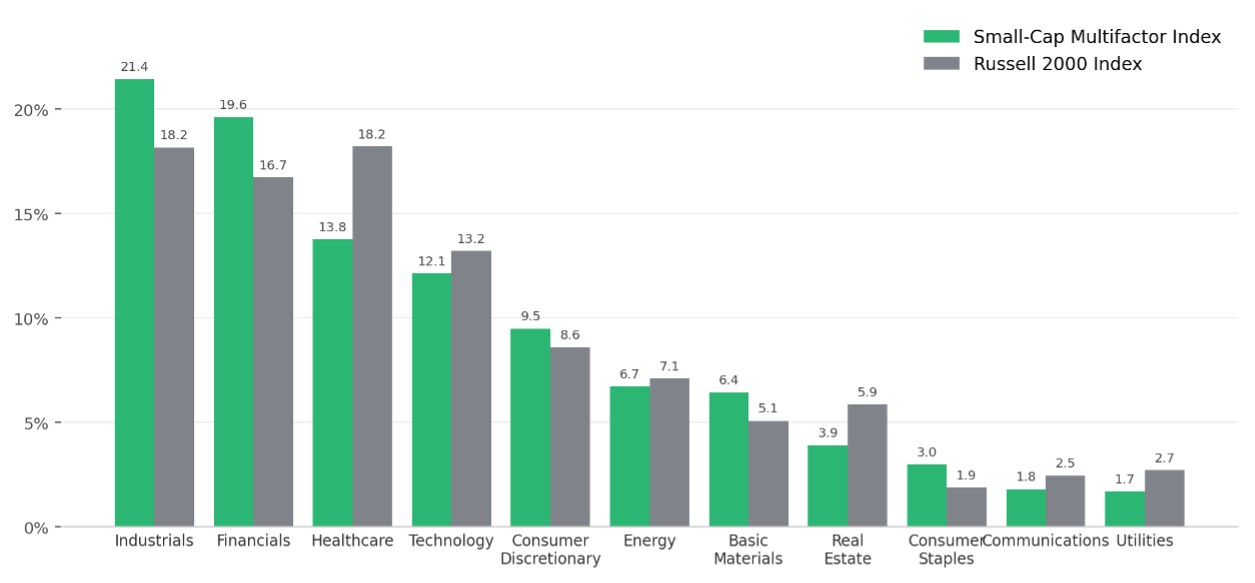
One of the clearest benefits of combining three factors is the more balanced sector profile. A Value-and-Quality screen alone can tilt heavily toward Financials in small caps, particularly banks, because many of those companies screen as both profitable and reasonably valued. Adding Price Momentum broadens the exposure by leaning the index model toward companies with stronger recent market confirmation.
The result is an index model with no dominant sector. Industrials is the largest weight at 21.4% versus 18.2% in the benchmark, followed by Financials at 19.6%, with Healthcare, Technology, and Consumer Discretionary all meaningfully represented. Relative to the Russell 2000, the index model is modestly overweight Industrials, Financials, and Basic Materials, driven by strength in capital goods, banks, and metals and mining. The largest underweights are Healthcare and Real Estate, where the Quality and Momentum screens reduce exposure to more speculative or rate-sensitive areas of the small-cap market.
Advisors who want to constrain any of these sector tilts can layer in sector overweight or underweight controls in Syntax Direct without changing the underlying factor methodology.
Top 10 Holdings
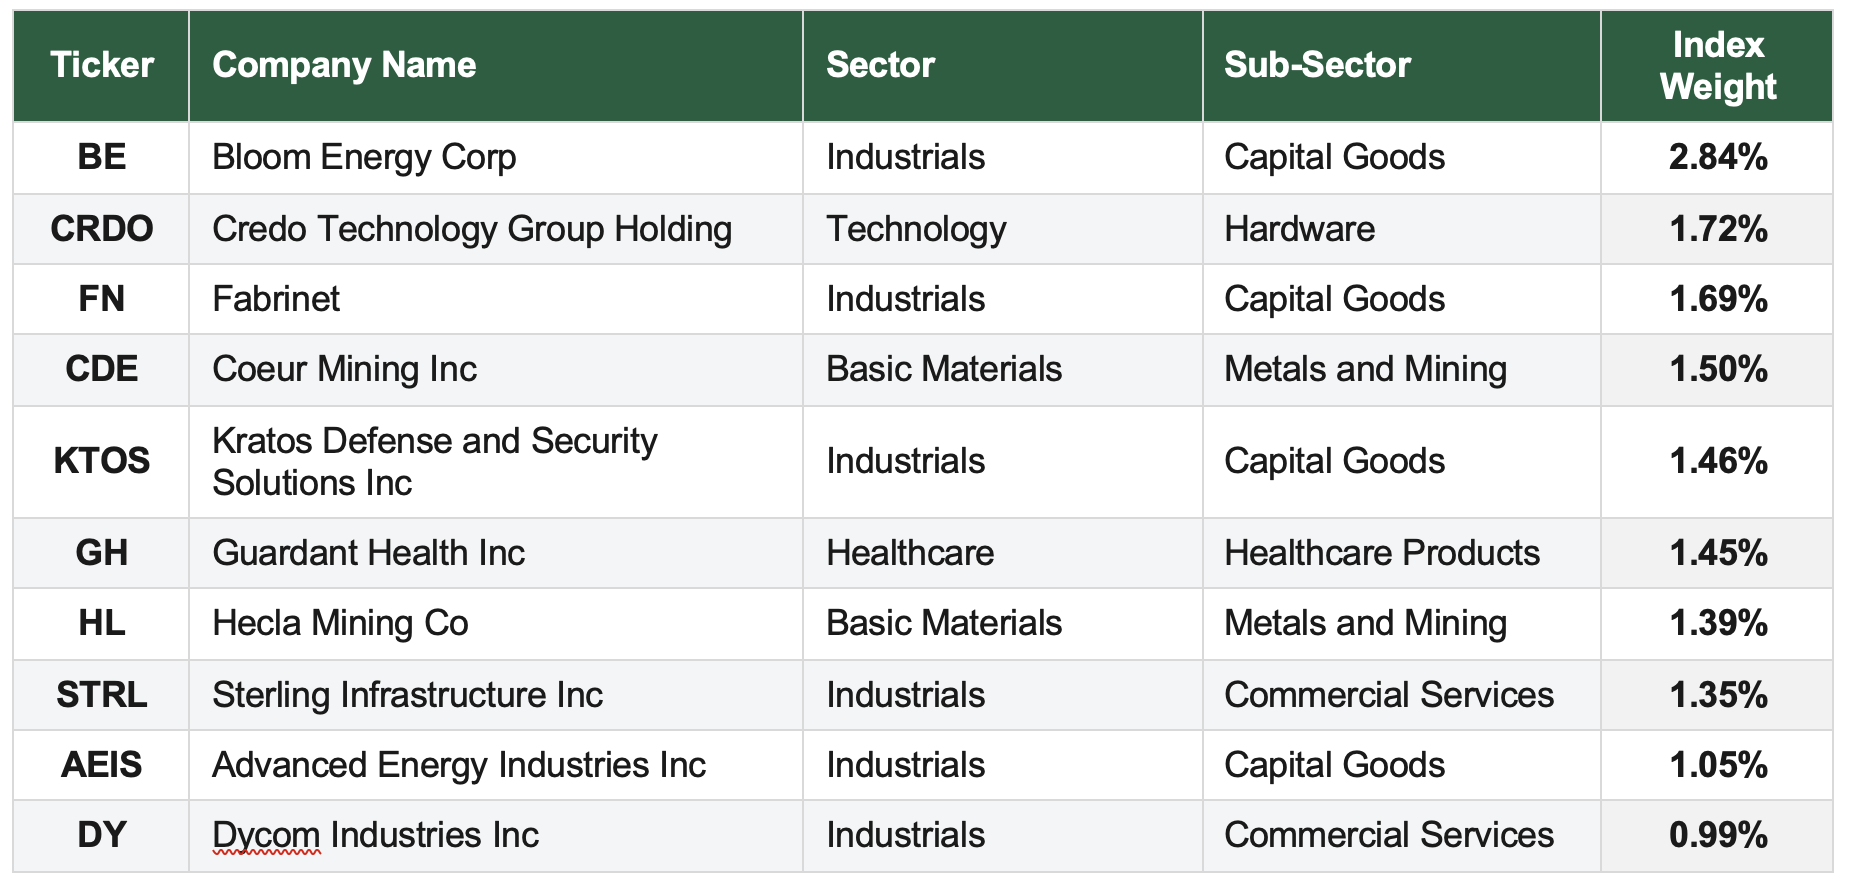
Exhibit 3 lists the ten largest constituents of the index model as of the most recent rebalance. The holdings illustrate the kind of companies surfaced by the multifactor process: reasonably valued, financially sound small caps with positive price trends. Bloom Energy is the largest position at 2.84%, followed by a diversified mix of technology, capital goods, infrastructure, metals and mining, and healthcare names.
The index model is notably diversified at the security level. The largest position is under 3%, and the top ten holdings together account for roughly 15% of the total weight. That concentration profile is a sharp contrast to many large-cap core portfolios, where the largest few names can represent a much larger share of total.
Exhibit 3: Top 10 Holdings
Backtested Performance
Syntax Direct calculates backtests for indices modeled on the platform beginning on December 15, 2017. Exhibit 4 shows the hypothetical growth of $1,000 invested in the Small-Cap Multifactor Index Model and the Russell 2000 benchmark from backtest inception through May 31, 2026.
Exhibit 4: Growth of $1,000: Small-Cap Multifactor vs. Russell 2000 Benchmark
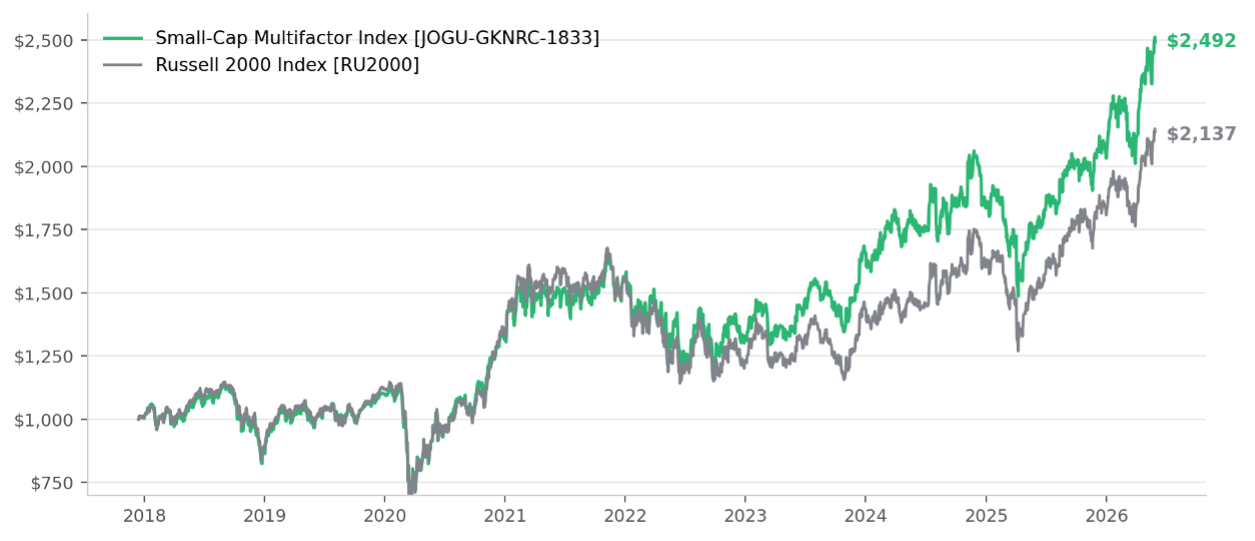
Over the full backtested period, the index model grew $1,000 to $2,492, representing an annualized total return of 11.41%. Over the same window, the Russell 2000 grew the same $1,000 to $2,137, an annualized total return of 9.40%. The index model outperformed by 201 basis points per year on a compound basis, gross of fees and expenses.
The two indices tracked one another closely through 2021, consistent with a high-conviction tilt that remains broadly diversified across 500 small-cap names. The multifactor index model first distinguished itself on the downside, declining only 15.1% in 2022 versus 20.4%for the Russell 2000, as the Quality and Value screens helped reduce exposure to more speculative and rate-sensitive small caps. The index model then extended its lead in 2023, returning 25.4% versus 16.9% for the benchmark, as fundamentals were rewarded.
The modeled strategy gave back a modest amount of relative return in 2024 and 2025, when broader small-cap participation and lower-quality recoveries supported the benchmark. Over the trailing year, the multifactor index model and benchmark were effectively even, with the index model returning 43.11% versus 43.08% for the Russell 2000. This pattern is consistent with a Quality-and-Value-anchored multifactor strategy: it may lag in sharp, speculative rallies, but is designed to compound more effectively over full cycles and in more discerning market environments.
Exhibit 5: Performance and Risk Statistics

On a risk-adjusted basis, the modeled strategy delivered a 5-year Sharpe ratio of 0.35 versus 0.15 for the benchmark, and a 3-year Sharpe ratio of 0.90 versus 0.77, with only marginally higher volatility. The 5-year beta of 0.99 indicates the index model moved roughly one-for-one with the benchmark, while the 0.98 correlation confirms that it still behaved recognizably as a core small-cap allocation, suitable as a primary small-cap holding rather than a satellite position. The maximum drawdown of -40.2% in the model was modestly shallower than the benchmark’s-41.8%. All told, reducing the universe to 500 names and adding a high-conviction multifactor tilt produced 4.21% annualized tracking error against the Russell 2000.
Exhibit 6: Calendar Year Total Returns

Index Fundamentals
The fundamental profile of the tilted index model reflects its Value and Quality orientation. Exhibit 7 compares key fundamental metrics for the Small-Cap Multifactor Index Model and the Russell 2000 benchmark as of the most recent rebalance.
Exhibit 7: Index Fundamentals: Small-Cap Multifactor vs. Russell 2000 Benchmark
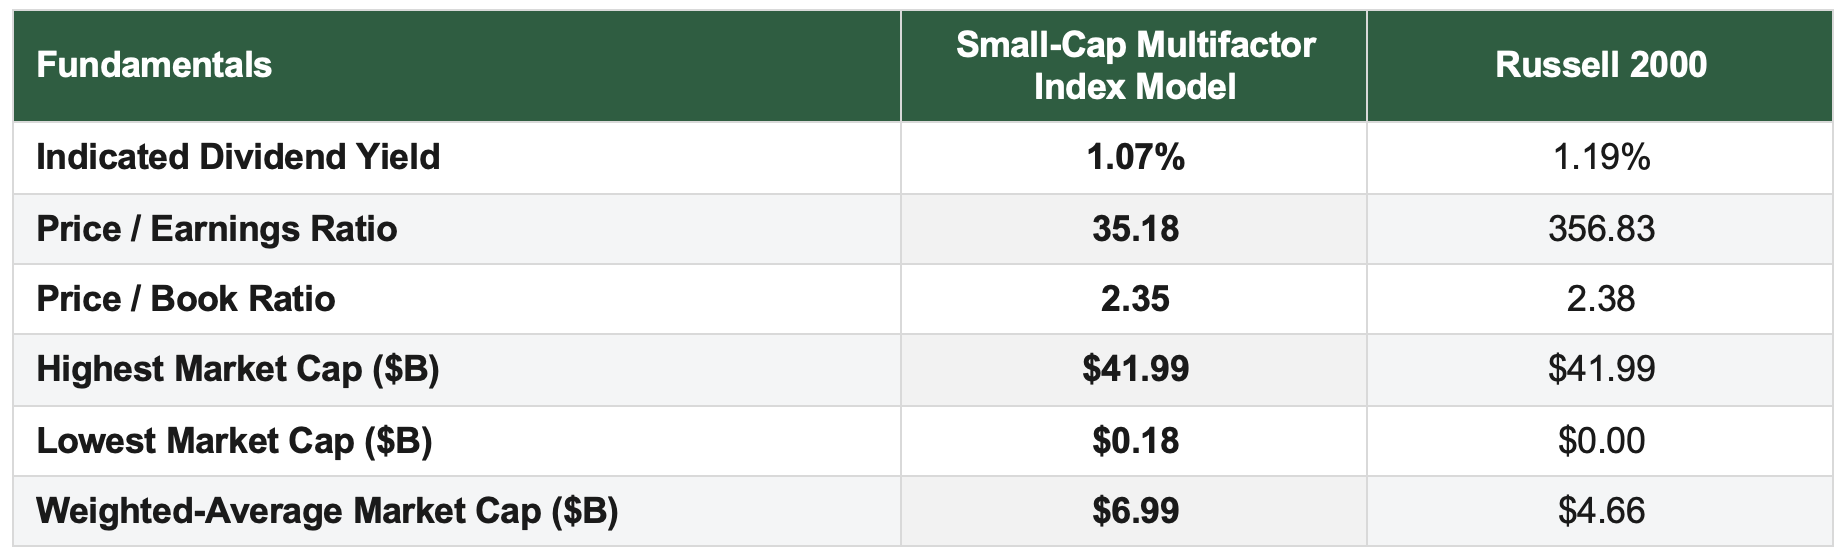
The weighted-average market cap of $6.99 billion is meaningfully higher than the benchmark's $4.66 billion, reflecting the tilt away from the smallest and most speculative constituents in the Russell 2000. The price-to-book ratio of 2.35 is essentially in line with the benchmark's 2.38, while the indicated dividend yield of 1.07% is modestly below the benchmark's 1.19%.
The price-to-earnings comparison requires more context. The Small-Cap Multifactor Index Model has a P/E ratio of 35.18, while the Russell 2000 shows 356.83 on the same platform, index-level basis. Small-cap P/E ratios can be difficult to compare because many constituents have minimal or negative trailing earnings, which distort aggregate index-level calculations and inflate the benchmark figure in particular. The more useful takeaway is that the multifactor process tilts the index model toward larger, more established small-cap companies while maintaining broad exposure to the asset class.
Putting It Into Practice
This case study illustrates how an advisor can use Syntax Direct to build a custom small-cap index that pursues a specific investment thesis, in this case disciplined exposure to reasonably priced, financially sound companies with positive market trends, without sacrificing the breadth and recognizability of a core small-cap allocation. The platform handles the heavy lifting: factor scoring, sector-relative tilting, weighting, rebalancing, and backtesting are all performed automatically based on the advisor's selections.
Beyond the basic construction shown here, Syntax Direct supports a wide range of additional customizations that can be layered onto this index design. Advisors can add a sector cap to constrain Industrials or Financials exposure, exclude specific tickers to manage concentration risk against client holdings, adjust the conviction level to dial the factor strength up or down, or extend the methodology to other universes including the Syntax 3000 or the broader Russell U.S. Index Family. Every index created on the platform comes with an automatically generated factsheet and a compliance-ready index rulebook that documents the assumptions used in its construction.
To learn more about Syntax Direct or to schedule a demo, please visit www.syntaxdata.com or contact sgrieco@syntaxdata.com.