

Key takeaways:
- When classified by primary sector, Information Technology (56%) is the largest sector based on the market value of the Magnificent Seven.
- Approximately 88% of the Magnificent Seven’s market cap exposure is tied to technology, including 24% in Communications via digital platforms and 8% in Consumer Discretionary through Amazon’s e-commerce business.
- In the growing cloud computing services market, Amazon has $108 billion in revenue compared to Microsoft at $98 billion; Alphabet is a distant third at $43 billion.
- Amazon has the highest total revenue ($638 billion) followed by Apple ($383 billion); Tesla has the least ($98 billion).
- Nvidia’s revenue topped $130 billion based on its January 26, 2025 annual report, up from $61 billion the prior year. AI chips account for 88% of the firm’s revenue as of its most recent annual report, up from 27% in 2020.
Overview
The Magnificent Seven (Apple, Alphabet, Amazon, Microsoft, Meta Platforms, Nvidia, Tesla) rightfully receive a lot of attention given their substantial impact on market performance in the past few years. Each stock has had its moment in the sun, though they’ve spent some time in the shade as well. The baton of leadership keeps passing, often driven by new technology (AI, cloud, EVs), macro conditions (interest rates, inflation), and market cycle positioning. Over the past five years, the broad US large cap market, measured by the Syntax 500, has returned 14.6% as of August 31, 2025. The same index, excluding the Magnificent Seven, returned 12.4%, underperforming by 220 basis points annually. Over this five-year period, the Syntax 500 cumulatively returned 97.7%, which was 23% higher than the 79.2% cumulative return for the index without the Magnificent Seven. From June 30, 2020, through August 31, 2025, a period just over five years, the float-adjusted market cap of the Magnificent Seven increased from $5.8 trillion to more than $18 trillion.
This paper uses Syntax’s FIS™ Industry Classification System to analyze the Magnificent Seven’s business exposure, both individually and collectively at the product line level, to help investors gain a better understanding of the businesses that have been driving the market ever higher.
Exhibit 1 displays the Magnificent Seven’s market cap exposures at the sector, sub-sector, and industry levels, with each successive level providing more insights into the types of businesses these seven companies own. This analysis leverages Syntax’s data to calculate exposure to groups; each group’s weight is calculated by multiplying the weight of each company in the index by the percent of revenue earned from that group, summed across all companies.
Exhibit 1: Magnificent Seven Index Market Cap Exposure by Product Line Classification
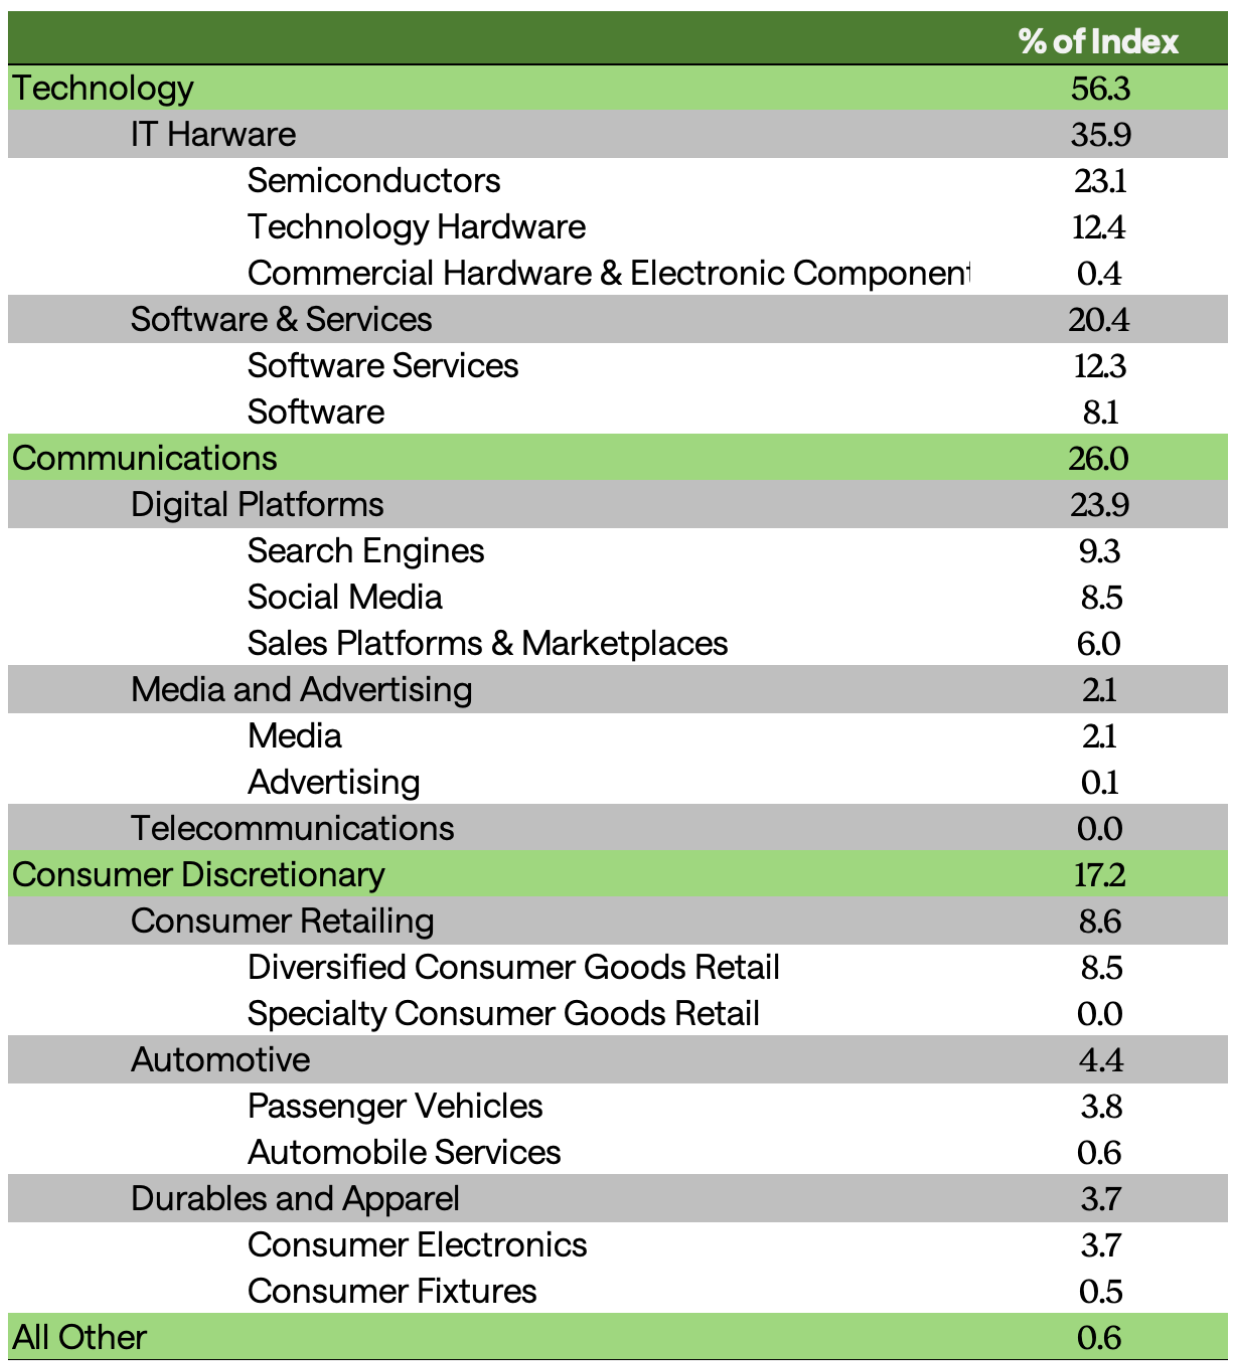
The top four industries comprise 57% of the Magnificent Seven’s market cap exposure, and the top eight (detailed below) account for 88%.
- Unsurprisingly, with the meteoric growth of Nvidia, the largest industry based on market cap values is Semiconductors at 23%. Based on revenue, Semiconductors represent just over 6% of the Magnificent Seven’s total sales.
- Technology Hardware is the second largest industry at 12%. This group includes Apple’s smartphones and computer products.
- Software Services, also at roughly 12%, is the third largest industry, driven by the Cloud Computing Services businesses of Microsoft, Amazon, and Alphabet.
- The fourth largest industry exposure is Search Engines at 9.3%, a space dominated by Alphabet.
- Diversified Consumer Goods Retail’s weight of 8.5% is entirely Amazon’s ecommerce platform.
- The 8.5% exposure to Social Media is attributable to Meta Platforms.
- Software represents 8.1% and is primarily driven by Microsoft.
- Sales Platforms & Marketplaces represent 6.0% of market cap and is tied to Apple and Alphabet’s mobile apps.
- Passenger Vehicle exposure provided by Tesla is 3.8% of the Magnificent Seven’s market cap and is the ninth largest exposure.
Exhibit 2 examines each company's product lines and specifies the percentage of company revenue associated with each.
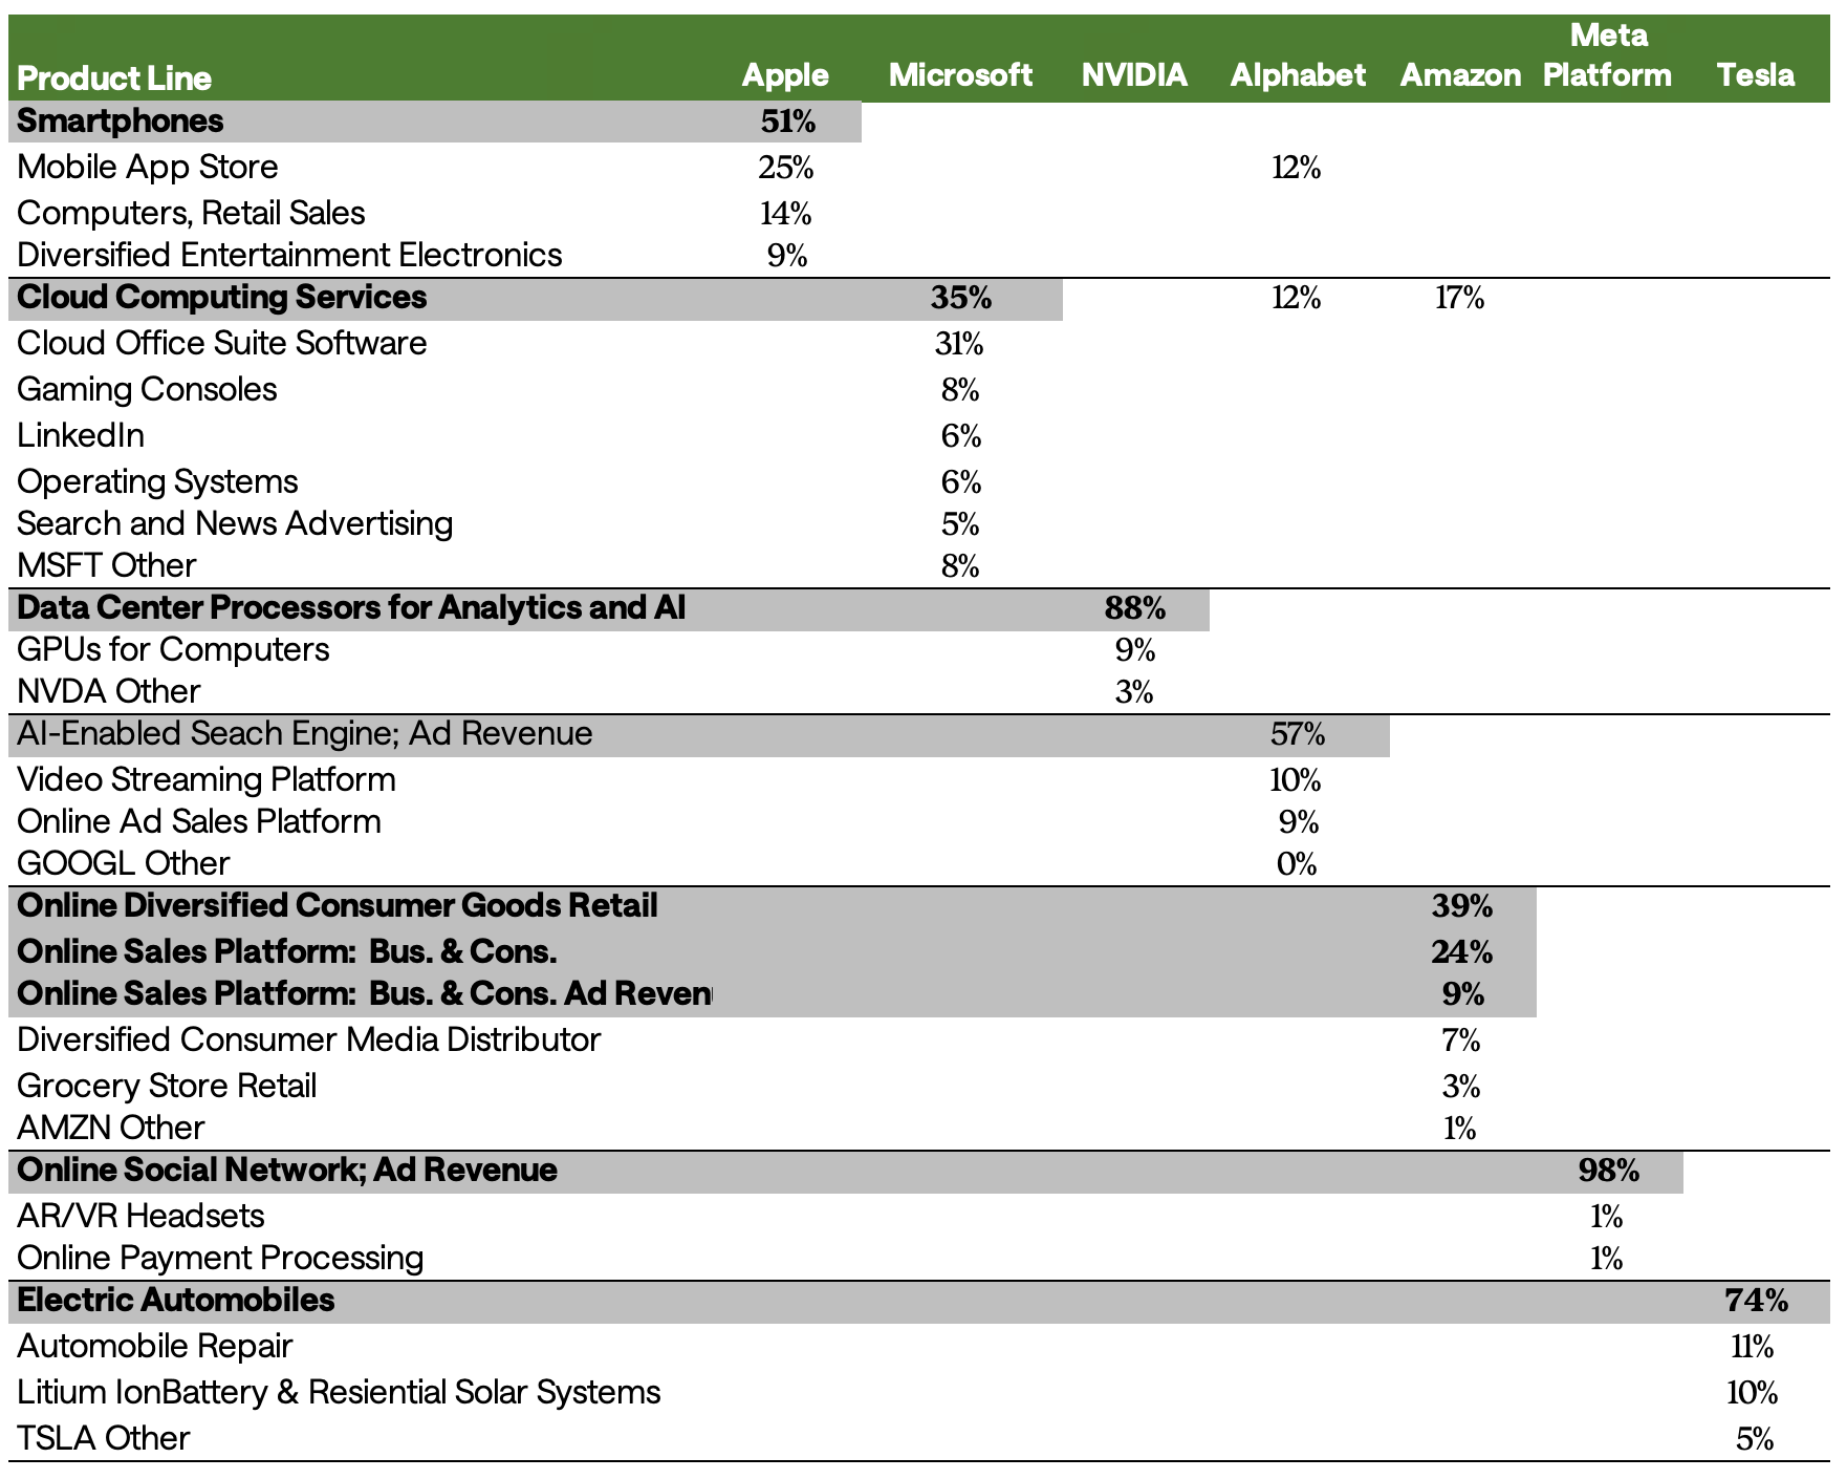
The areas shaded in grey represent the source of revenue / product line as a percent of total revenue within each company. The companies have varying degrees of product concentration risk. Here are some of the highlights:
- Alphabet has 57% of its sales tied to Ad Revenue generated by its search engine; the balance of its sales are relatively evenly split between its Cloud Computing Services, Mobile App Store, Video Streaming, and other Online Ad Sales platforms.
- Meta and Tesla are both close to being pure play companies, with one meaningful product line each.
Worth noting here is that outside of Cloud Computing Services (Microsoft, Amazon, Alphabet), and to a lesser extent Mobile App Stores (Apple, Alphabet), these firms exhibit minimal overlap across the industries in which they compete.
In Exhibit 3, we highlight each firm’s revenue by product line to provide a sense of the magnitude associated with these products.
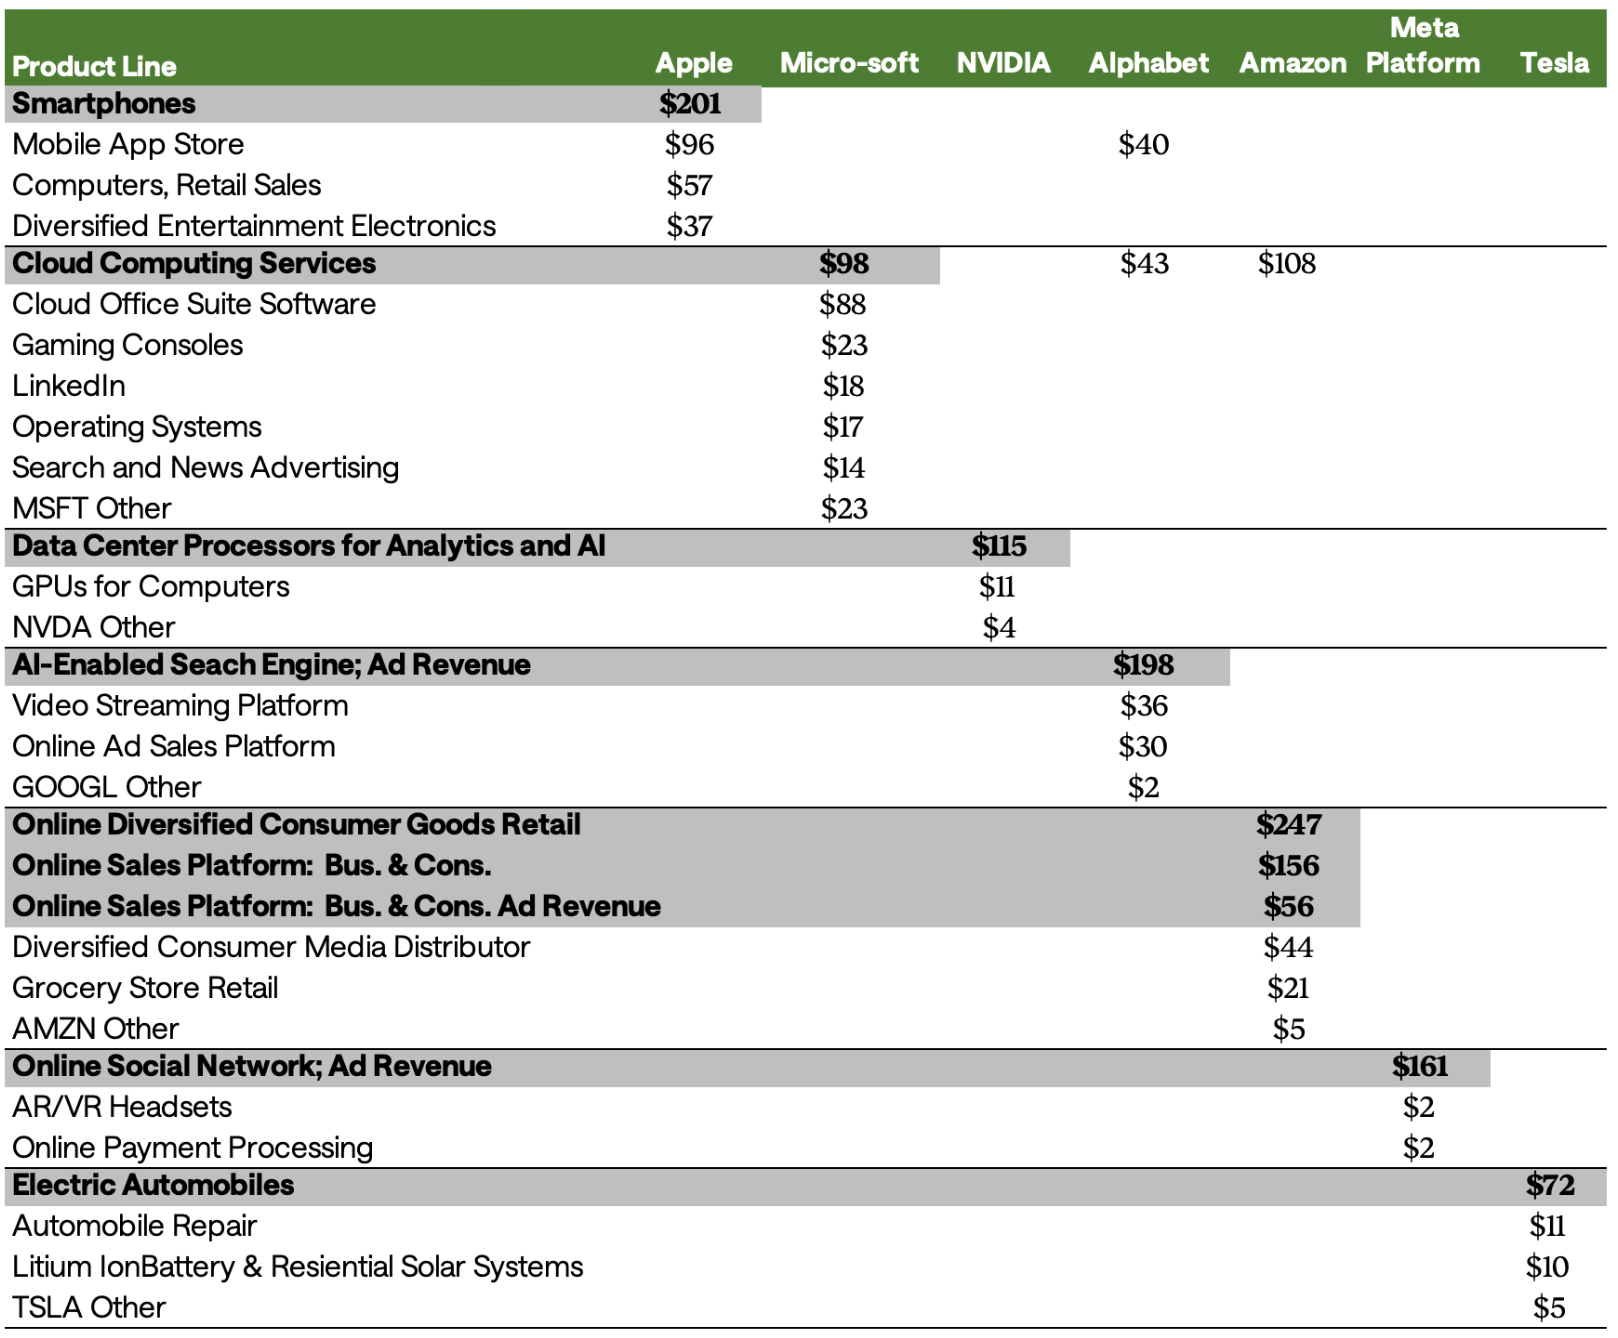
There are a number of interesting observations from the product line revenue data shown above:
- The revenue volume associated with Amazon’s online platform is about $460 billion, as shown in the three product lines highlighted in gray. This is by far the largest single source of revenue amongst the Magnificent Seven.
- The next top three largest product lines are Apple’s Smartphones ($201 billion), Alphabet’s Search Engine ($198 billion), and Meta Platforms Online Social Network: Ad Revenue ($161 billion).
- Product lines that generate in the vicinity of $100 billion in sales include Nvidia’s Data Center Processors for Analytics and AI ($115 billion) along with Amazon ($108 billion) and Microsoft's ($98 billion) Cloud Computing businesses.
- Microsoft’s Software ($88 billion) and Tesla’s Electric Automobiles ($72 billion) round out the other most notable product lines with substantial revenue.
The Magnificent Seven have been linked based on their use of innovation and technology to gain both scale and market-leading positions that have supported their remarkable growth. As of August 31, 2025, their float-adjusted market cap values range from $935 billion for Tesla to $4.2 trillion for Nvidia. In total they represent 33.6% of the S&P 500 and have a collective market cap of $18.4 trillion. They also have a variety of businesses with different margins which influences their valuations.
Exhibit 4 shows the price-to-sales ratio for each of the Magnificent Seven based on their August 31, 2025 float-adjusted market cap and revenue as of their most recently filed annual report.
Exhibit 4: Magnificent Seven Revenue ($ billion) & Market Cap as a Multiple of Revenue
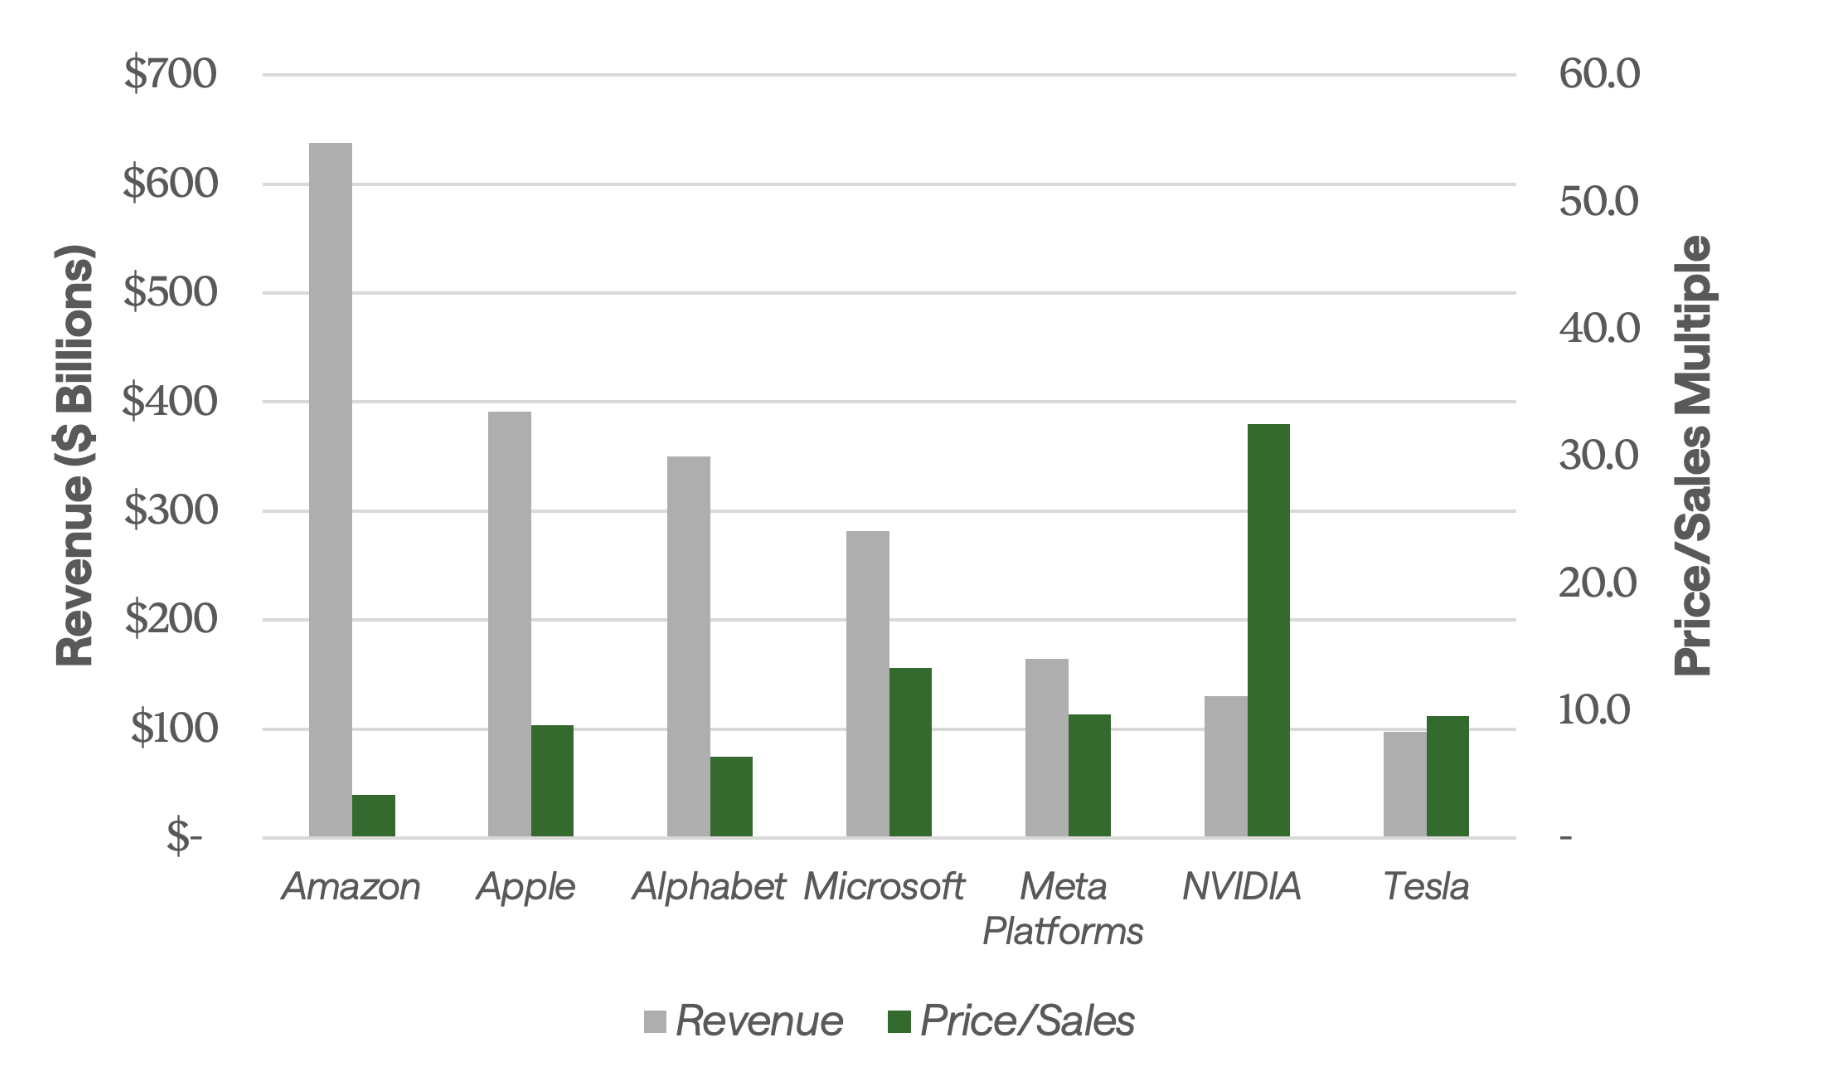
Among the seven companies, there are four distinct fiscal year-end reporting dates, so the results are not a true apple-to-apples comparison. That said, the exhibit does provide insights into their respective valuations. For example, unsurprisingly, Amazon has the lowest price-to-sales ratio (3.4x) driven by the comparatively low margins on its massive retail business. At the other end of the spectrum, Nvidia has a price-to-sales ratio of over 32x based on both the high margins on its AI chips and its growth rate, which exceeded 100% from its 2024 annual statement to 2025. Apple, Meta, and Tesla all have similar price-to-sales ratios of roughly 9x, even though their business models are quite different.
The Magnificent Seven’s influence on market performance stems from their technological expertise and market leading positions. While their individual valuations are influenced by differing revenue streams and margins, investor enthusiasm for their businesses continue to push the market higher. This analysis dissects their business exposure at the product line level using Syntax’s FIS™ Industry Classification System, which provides investors with a clearer understanding of the distinct underpinnings of these influential companies. To learn more about how you can gain access to Syntax’s product line data, please contact Sarah Grieco at sgrieco@syntaxindices.com.