Get in touch


Key Takeaways
- Energy is a small slice of the S&P 500 but a larger part of the economy. The Energy sector is 3.4% of the S&P 500 against an estimated 7.4% of U.S. GDP in 2023. The world’s appetite for energy appears to be increasing: estimates of peak oil demand have been pushed out and natural gas demand is supported by data center power needs.
- Syntax’s FIS® revenue classification data provides a unique perspective for understanding the set of business opportunities in the energy space. Using the Syntax US 3000 Energy Index, we see that 29.4% of the Energy sector is tied to Upstream (E&P) business activities, 17.7% to Midstream activities, 28.7% to Downstream activities, with the remainder split across oilfield services and equipment as well as trace revenue streams from other sectors.
- Higher volatility, moderate correlation. Over its roughly nine-year history, which includes backtested data, the Syntax Energy Index has been about twice as volatile as the broad U.S. market (34.7% vs. 16.9% annualized). Its correlation to the market is a moderate 0.60, but with a beta of 1.24 and large performance swings, position size and market entry point matter for investors considering the role of the Energy sector in their portfolios.
Introduction
It is hard to overstate the importance of energy. It is an input to manufacturing, transportation, food, and the world’s growing use of computing power. It heats and cools our homes and places of work, and it enables the modern economy. Despite energy’s economic importance, energy stocks are just 3.4% of the S&P 500 as of the end of Q3, while the oil and natural gas industry’s total contribution to the U.S. GDP was an estimated 7.4% in 2023.1 Nvidia, at 8.4% of the S&P 500, is more than twice the weight of the entire sector.2 This paper examines the Syntax US 3000 Energy Sector Index (the Syntax Energy Index, or the Index) to gain insights into the Energy sector’s underlying business exposures and risk and return profile.
A Changing Outlook
Around 2020, the working assumption among many forecasters was that fossil fuel demand was close to its ceiling.
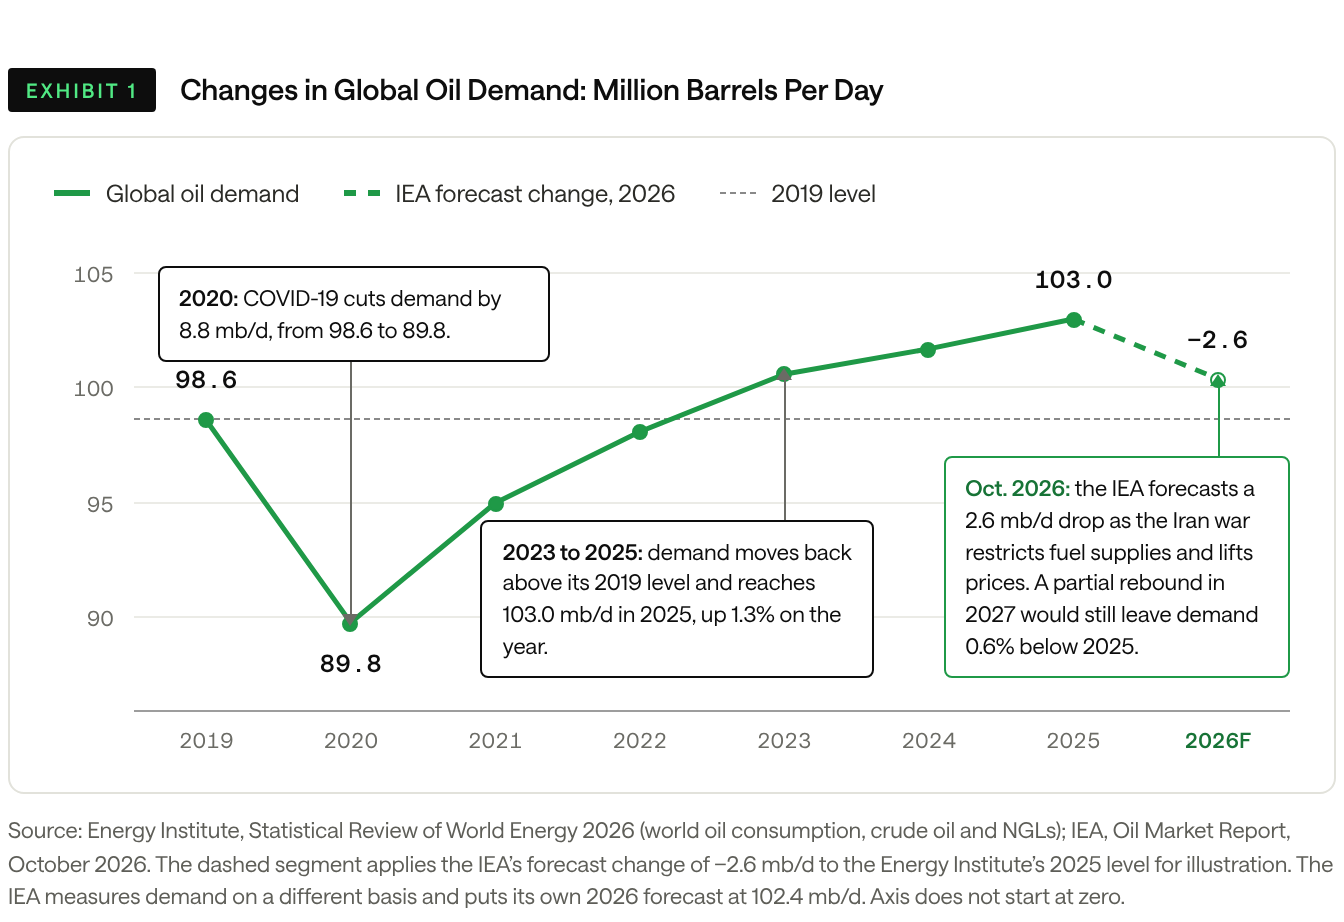
BP’s 2020 Energy Outlook suggested that oil demand may have already peaked in 2019, and the company committed to cutting oil and gas output by 40% by 2030 while growing renewables rapidly.3 The data since then tell a different story. Global oil demand reached about 103 million barrels per day in 2025, up from about 98.6 million in 2019.4 Growth has been slow by historical standards, but demand kept rising through 2025, and BP reversed course that year, raising oil and gas investment and cutting planned renewables spending.5
Looking forward, the outlook may be changing again. The IEA’s October 2026 Oil Market Report forecasts that global demand will fall by 2.6 million barrels per day in 2026, as the Iran war restricts product supplies, pushes fuel prices sharply higher, and weakens the economic outlook in some countries. As shown in Exhibit 1, the swing from the 2020 peak- demand view to rising demand through 2025 to a decline in 2026 shows how quickly the dynamics change and how hard oil demand is to forecast.
The IEA’s 2025 World Energy Outlook shows how much the outlook now depends on policy. It presents scenarios, not forecasts, under different sets of assumptions. Under its Current Policies Scenario, which assumes no new policies beyond those already in force, oil demand reaches 113 million barrels per day by mid-century. Its Stated Policies Scenario, which includes announced but not yet adopted policies, has oil demand peaking around 2030.6
Meanwhile, natural gas demand is supported by two drivers: liquefied natural gas (LNG) exports and power generation.
- LNG exports: In the IEA’s Current Policies Scenario, global LNG demand rises from a baseline of about 560 billion cubic meters (bcm) in 2024 to 880 bcm in 2035. Under its Stated Policies Scenario, which assumes faster renewable deployment and efficiency gains, it grows more slowly.7 As one sign of that growth, preliminary data show the U.S. became the first country to export more than 100 million metric tons of LNG in 2025.8 About 300 bcm of new annual export capacity is scheduled to start by 2030, around half of it in the United States.9 In the Stated Policies Scenario, that capacity outruns demand, leaving about 65 bcm unused in 2030.
- Power generation: Artificial intelligence is one of the forces behind rising domestic gas demand. The IEA projects that global data center electricity demand will more than double to about 945 terawatt-hours by 2030, and that natural gas generation will expand by 175 terawatt-hours by 2035 to help meet data center demand, notably in the United States.10 Natural gas is the largest single source of electricity for U.S. data centers, at over 40%, and the IEA expects it to supply the biggest share of new data center demand through 2030.11
Understanding the Energy Sector
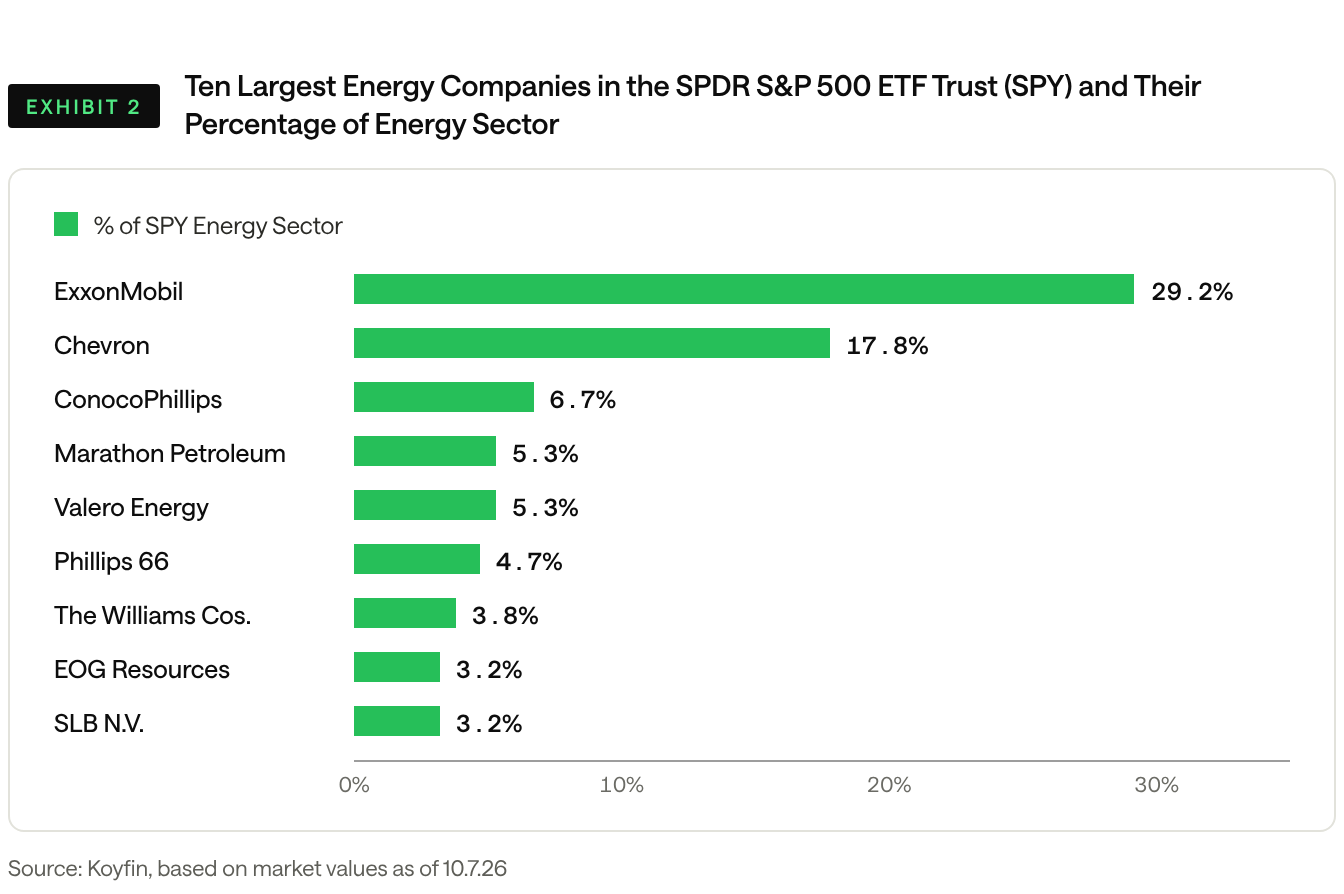
The Energy sector within the S&P 500 has just 21 individual companies, according to GICSclassifications. Exhibit 2 shows the 10 largest Energy companies in the S&P 500 EnergySector Index and their weight in the sector. ExxonMobil (29.2%) is the largest holding,followed by Chevron (17.8%).
The State Street Energy Select Sector SPDR ETF (XLE), the largest ETF tracking this sector, is slightly less top-heavy, as it caps the largest weight to comply with concentration regulations. Even with that cap, however, Energy is a very top-heavy sector, with the two largest holdings accounting for 41% of the weight in XLE, and the top 10 names collectively accounting for over 75% of weight in both the S&P 500 Energy Sector and XLE.
The Syntax Energy Index provides a wider measure of the Energy sector and is the basis for the analysis below. It draws from a broader universe, the Syntax 3000, to include companies from across the cap spectrum, extending from 21 companies in the S&P 500 universe to 144. This expanded opportunity set includes smaller producers, midstream infrastructure operators, refiners, and oilfield service companies that are underrepresented or missing entirely in the large-cap universe. The Index also applies a single-security weight cap of 4.5% to limit the bias toward the largest names. The result is a broader measure of the full opportunity set in the U.S. Energy equity market.
Looking Inside the Index
Our analysis is based on a drill-down approach that uses Syntax’s FIS® industry classification system. Exhibit 3 shows Index weights for the 10 largest holdings.
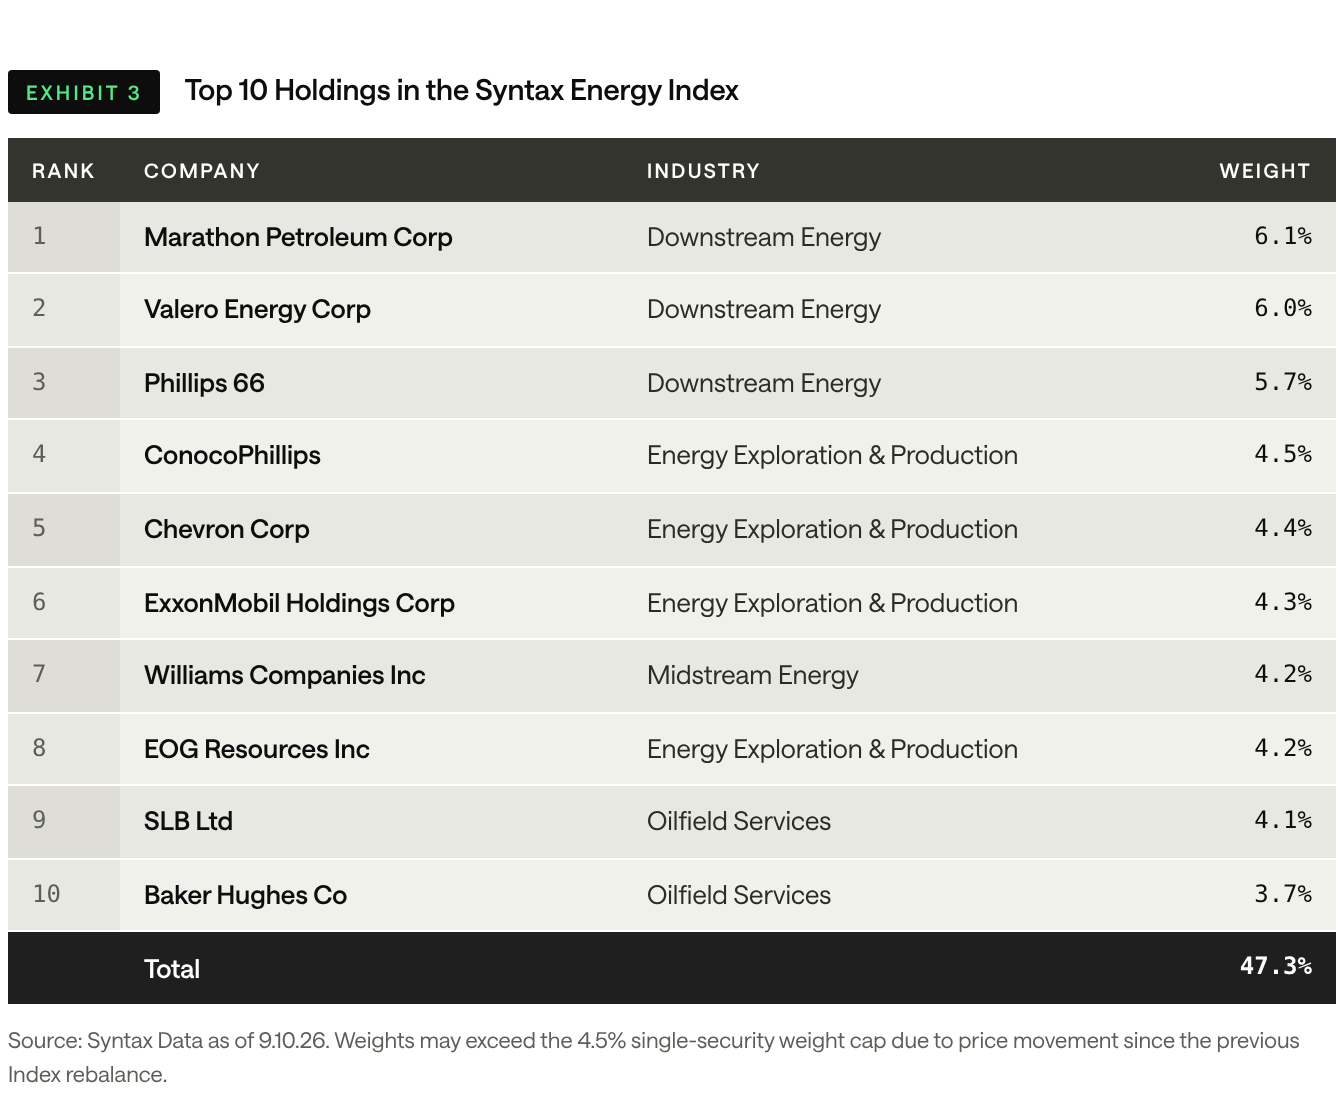
The ten largest holdings make up 47.3% of the Index. Weights range from 6.1% (Marathon Petroleum) to 3.7% (Baker Hughes), reflecting price moves since the last quarterly reset to the 4.5% weight cap. Each company’s industry classification is shown, highlighting:
- The three largest positions (Marathon Petroleum, Valero, Phillips 66) total 17.8% and are focused on Downstream Energy, and more specifically refining.
- The four Energy Exploration & Production-focused companies (ConocoPhillips, Chevron, ExxonMobil, EOG Resources) total 17.5%.
- There is one Midstream (pipeline)-focused company (Williams Companies) at 4.2%, and two Oilfield Services companies (SLB and Baker Hughes) that make up 7.8% of the Index.
However, not every company is a pure play offering a single product. In fact, most companies have multiple product lines, and in some cases these may even cross sectors.
Exhibits 4 through 6 look through to how the Index holdings generate revenue using FIS® product line classification data. For each company, we take the share of its revenue in each industry (Exhibit 4), sub-industry (Exhibit 5), and product line (Exhibit 6), multiply it by the company’s weight in the Index, and sum across companies to calculate the Index-weighted revenue.
Exhibit 4 examines the top 10 Industry exposures, which represent 96% of the Index-weighted revenue.
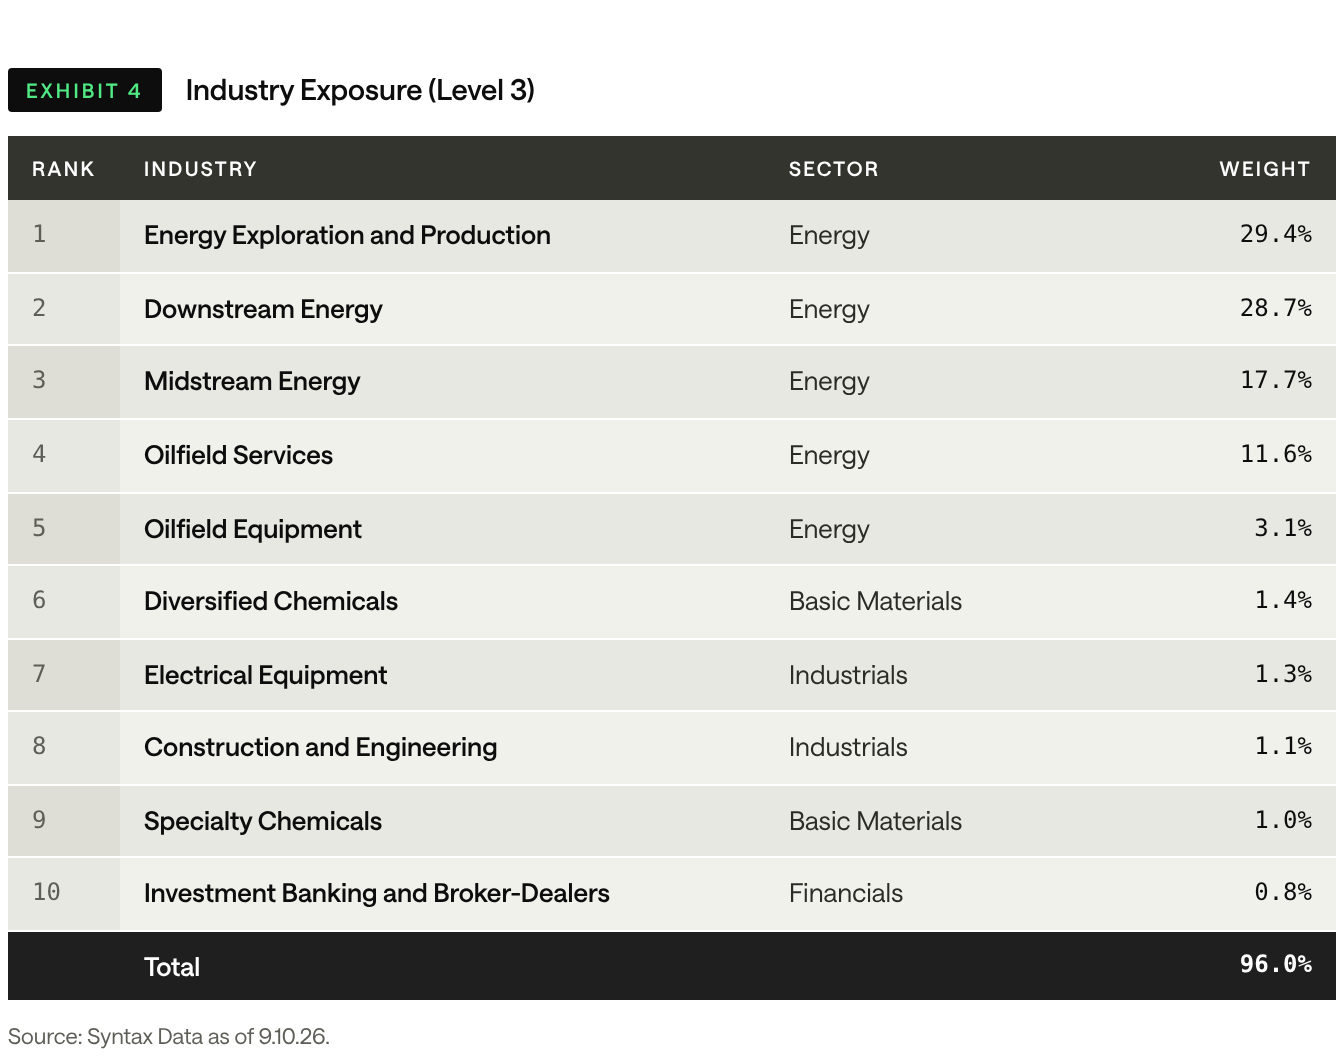
The top ten industries in the Index break down as follows:
- E&P (29.4%) and Downstream Energy (28.7%) are the two largest components, representing 58% of the Index-weighted revenue. E&P is how FIS® classifies Upstream activity, while Downstream Energy includes Refining, Petrochemicals, and Distribution.
- Midstream (17.7%) transports, stores, and processes primarily natural gas. This includes companies like Williams.
- Oilfield Services (11.6%) and Oilfield Equipment (3.1%) are related industries that round out the top five exposures, which in total add to 90.4%.
- Some holdings are diversified into surprising industries. For example, Williams Companies earned 18.8% of its 2025 revenue from the Investment Banking and Broker-Dealer Industry activities linked to its Commodity Trading product line.
Exhibit 5 identifies the top 10 sub-industries in the Syntax Energy Index.
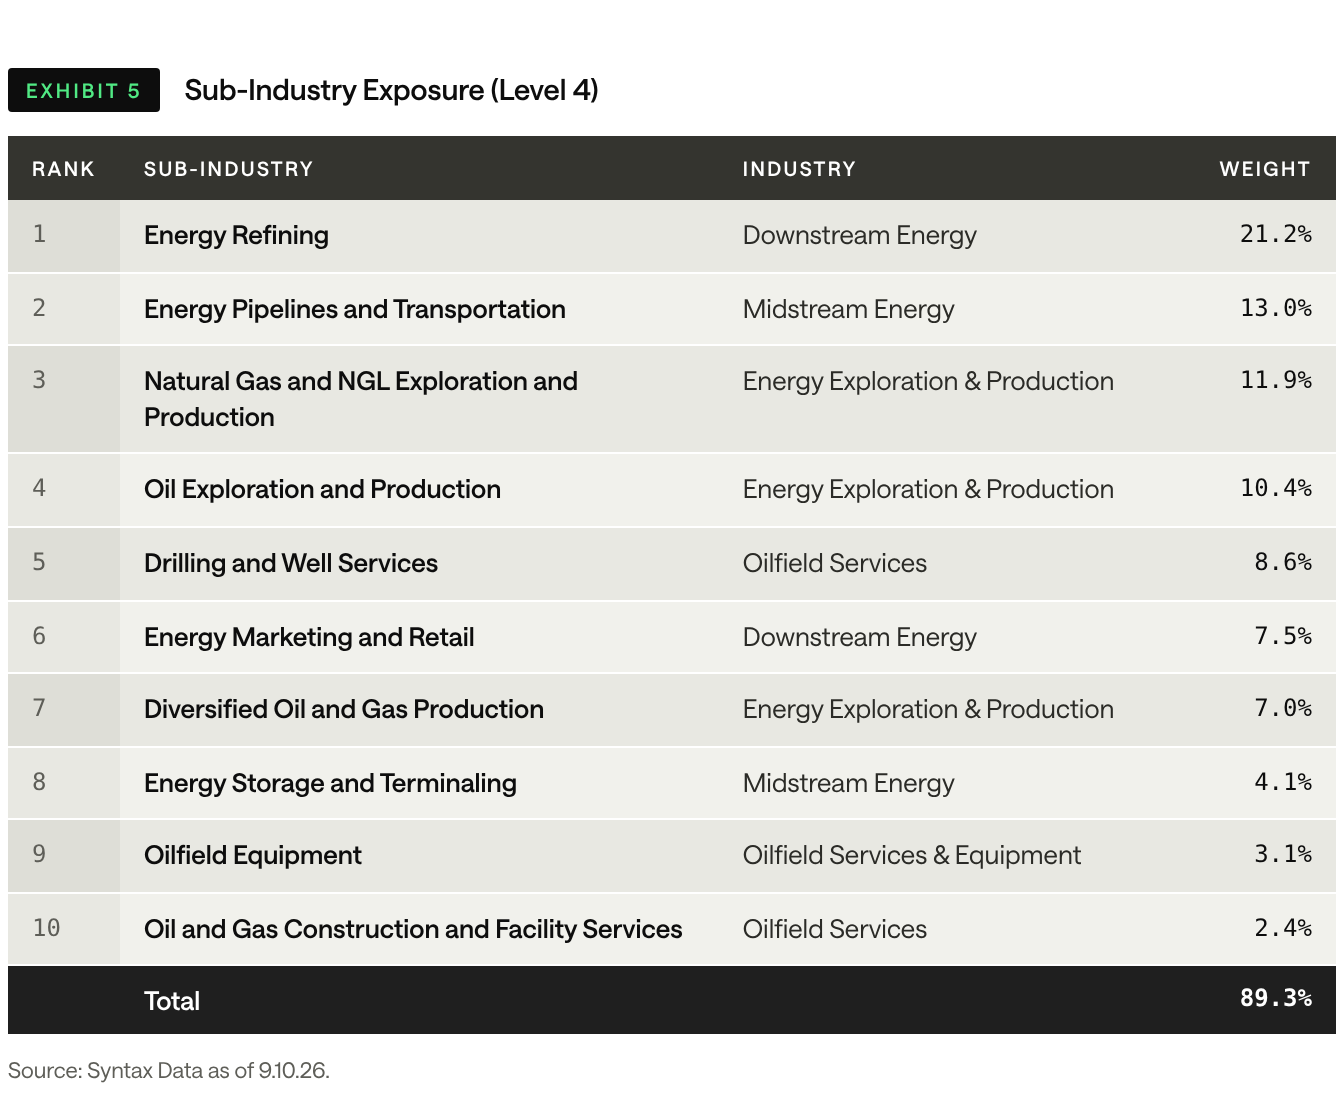
The four largest sub-industries account for 56.5% of the Index-weighted revenue. They span three parts of the value chain: refining, midstream, and production. Each earns money differently, so each responds to commodity prices, demand, and volumes in its own way.
- Energy Refining (21.2%) is the largest single sub-industry, at roughly 1.6x the size of the next largest. Refiners turn crude into gasoline, diesel, and jet fuel, and earn money on the spread between crude costs and product prices (the crack spread) rather than on the price of oil itself.
- Pipelines and Transportation (13.0%) represents the midstream businesses that gather, process, move, and store oil, natural gas, and NGLs. Revenue is often fee-based and tied to volumes rather than commodity prices, so earnings tend to be steadier than those of producers or refiners.
- Natural Gas and NGL Exploration and Production (11.9%) covers producers focused on natural gas and the liquids extracted with it. Results track natural gas prices and, for NGL-rich producers, propane and ethane pricing. Demand drivers include power generation, LNG exports, and petrochemical feedstock.
- Oil Exploration and Production (10.4%) covers producers focused primarily on crude oil. Earnings are tied most directly to oil prices, making this the most commodity-sensitive group in the top four.
Exhibit 6 rolls up Index-weighted revenue to the product line level for the 15 largest individual product line classifications in the Index. To illustrate the calculation, the 14th largest product line is “Well Completion Services (excluding national oil companies, or NOCs)”. SLB, formerly known as Schlumberger, contributes 1.51% of Index-weighted revenue to that line, calculated by multiplying its Index weight (4.1%) by the 36.4% of its revenue earned in this business according to Syntax’s FIS® revenue data.
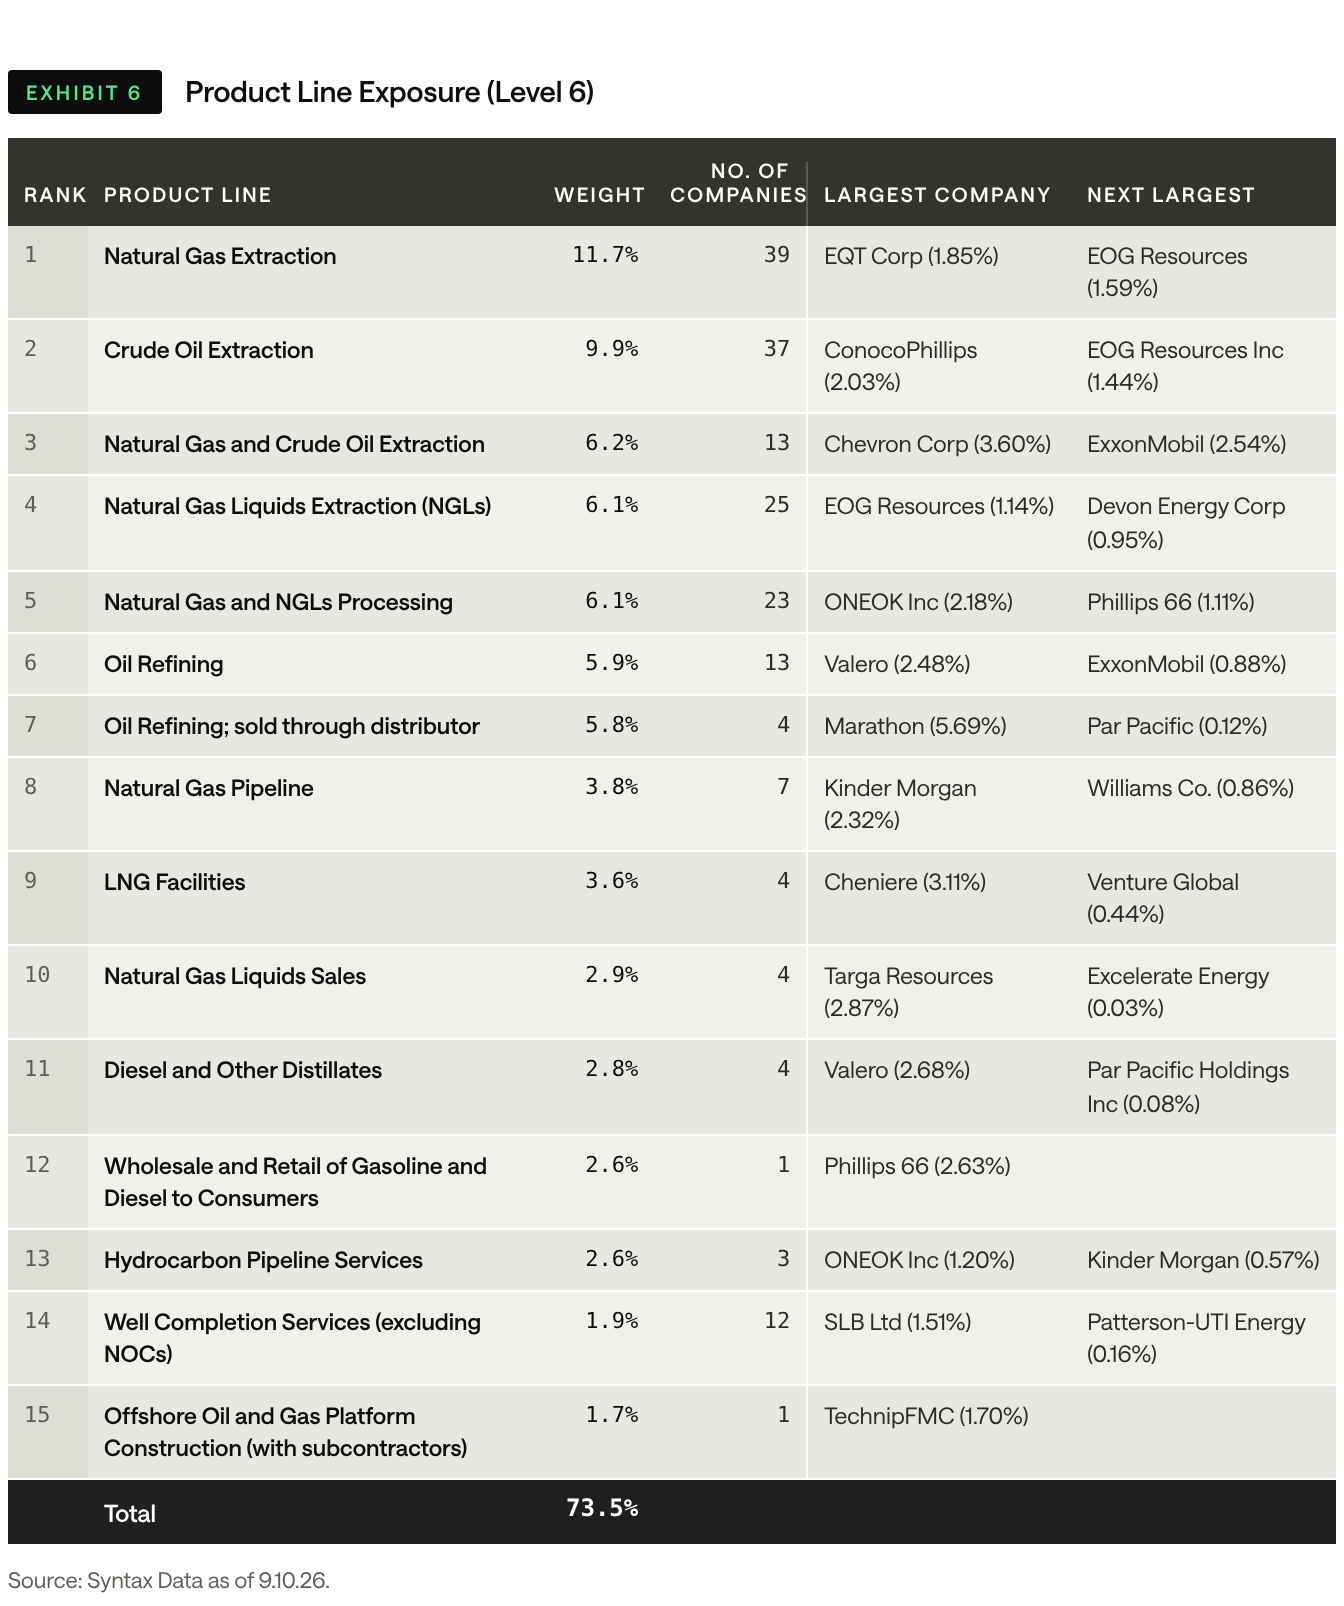
The product line analysis reveals:
- Natural Gas Extraction (11.7%) and Crude Oil Extraction (9.9%) are the first and second largest product lines, while the third largest combines them as Natural Gas and Crude Oil Extraction (6.2%), which is used to classify companies that report these activities less granularly. For example, EOG Resources reports Natural Gas and Crude Oil separately, while Chevron and ExxonMobil do not disaggregate.
- Grouped by commodity, gas-linked lines are about 36% of the Index-weighted revenue and oil-linked lines about 27%.
- The last two columns of the table show which company drives each product line, and several are dominated by one company. For example, Cheniere accounts for 87% of the Index-weighted revenue in LNG Facilities, Targa for 99% in NGL Sales, and Marathon for 98% in Refining Sold Through Distributors.
Performance
Energy has been a strong-performing sector in recent years, perhaps unsurprisingly given geopolitical events that have put strong upward pressure on oil prices. At the same time, Energy has been considerably more volatile than the market as a whole. The trailing annualized performance and standard deviation for the Syntax Energy Index and the Syntax 3000 Index are shown in Exhibit 7. Results before each index’s live date (5.15.24 for the Syntax Energy Index and 6.17.22 for the Syntax 3000 Index) are backtested.
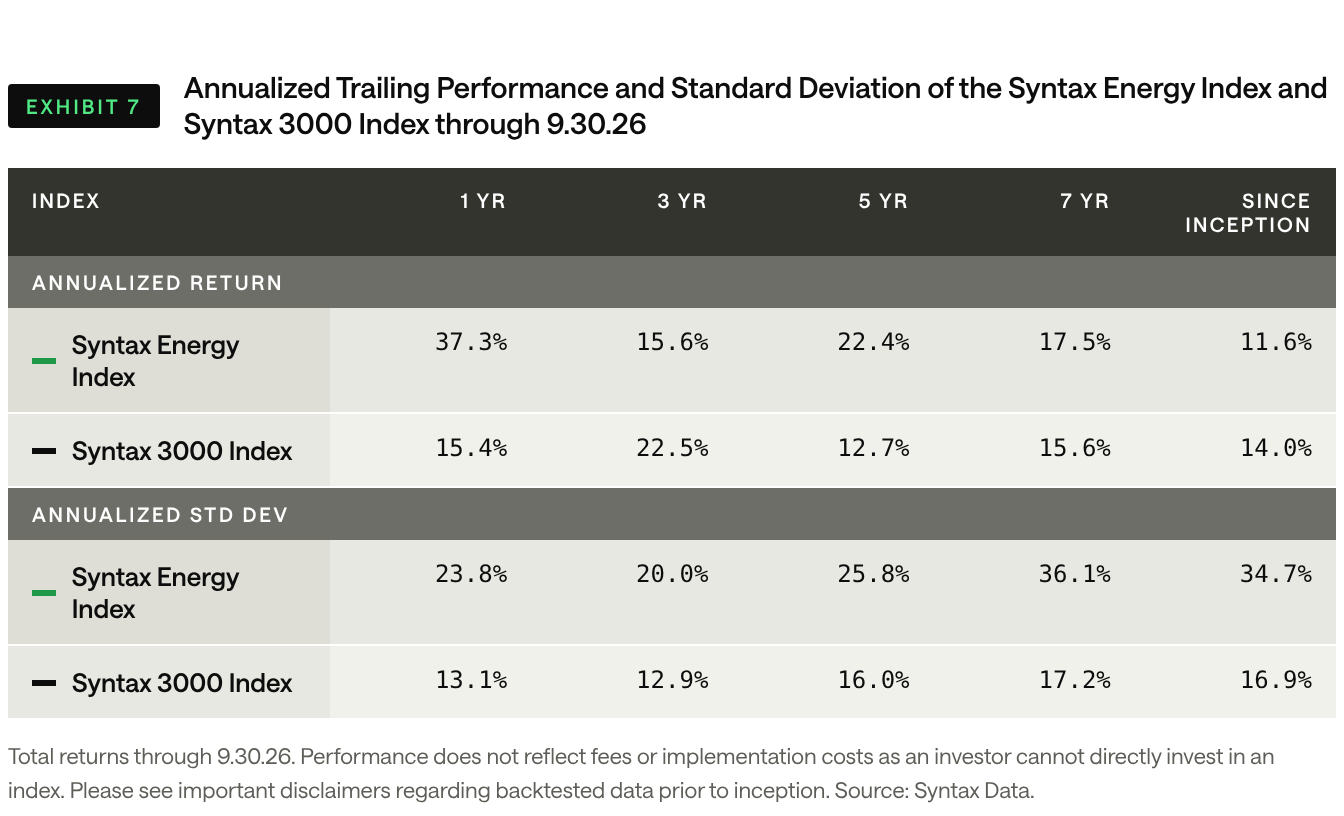
- The Syntax Energy Index outperformed the Syntax 3000 Index over the 1-, 5-, and 7-year periods and trailed it over the 3-year period and since the start of its backtest in December 2017 (11.6% against 14.0% a year). Only the 1-year period is entirely live for both indices; the other periods include backtested results.
- Volatility is much higher, reflecting commodity price cycles and geopolitical events. Since the start of the backtest, the Index’s standard deviation (34.7%) is about twice that of the Syntax 3000 Index (16.9%).
The growth of a hypothetical $1,000 since the start of the backtest is shown in Exhibit 8. Over this period, the Syntax Energy Index ($2,626) has underperformed the broad market as measured by the Syntax 3000 Index ($3,153).

The two lines diverge and then converge over time. Exhibit 9 shows rolling 1-year returns for both indices, including backtested results. Over the full period, the Energy Index’s correlation to the Syntax 3000 Index is a moderate 0.60, but its beta is 1.24.
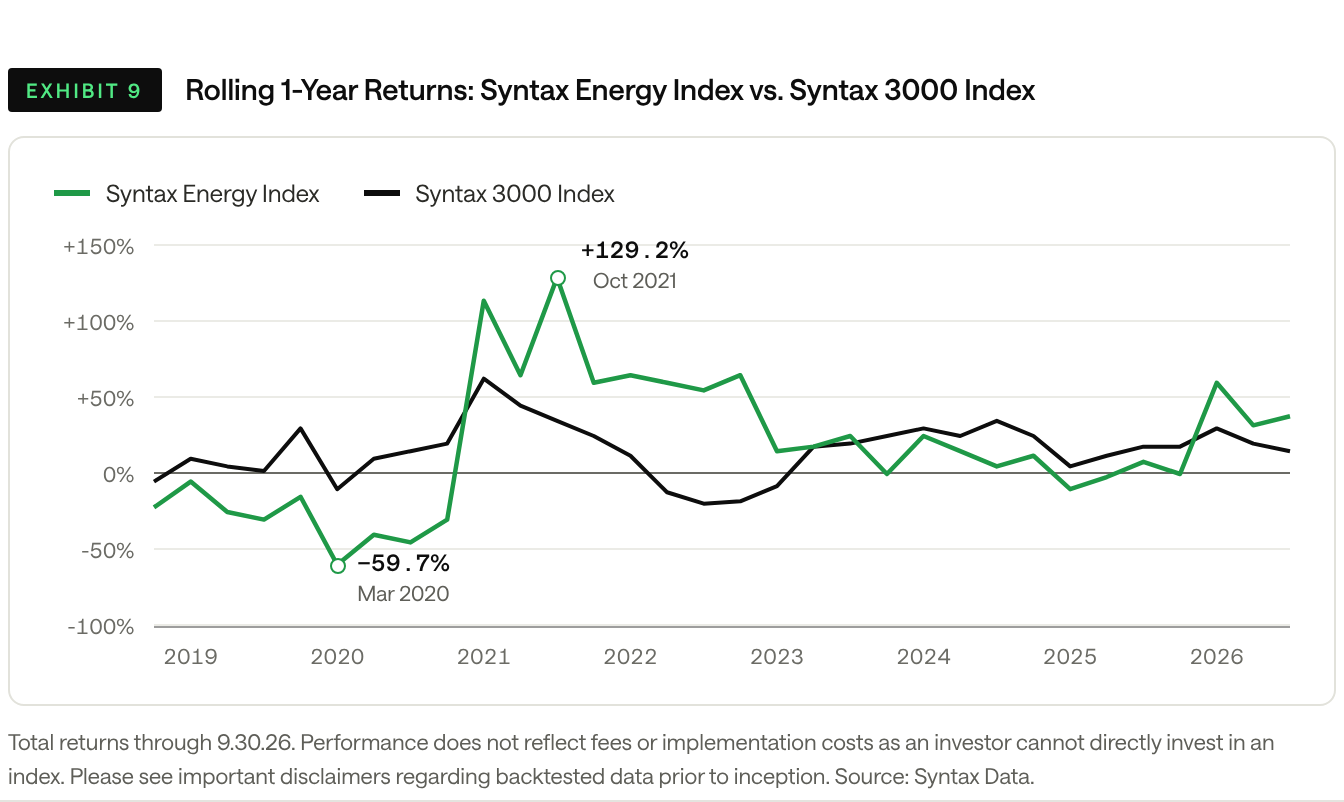
The Syntax Energy Index’s rolling 1-year return has ranged from −59.7% (March 2020) to +129.2% (October 2021), both in the backtested period. The Syntax 3000 Index’s range was −19.5% to +62.7%.
- In the backtest, the Energy Index underperformed dramatically in 2019 and 2020, a stretch that includes the COVID-19 pandemic.
- This period was followed by strong backtested outperformance for the 2021 and 2022 rolling return periods, with 2022 representing a tech-driven bear market where the S&P 500 and S&P 500 Growth indices returned −18.1% and −29.4%, respectively.12
- From roughly 2023 through September 2026, the performance differential has narrowed between the indices, with the Energy Index outperforming year to date.
Conclusion
It may be hard to fathom, but in 1980, Energy was the largest sector in the S&P 500 with a 28% weight.13 Today, Energy represents just 3.4% of the S&P 500, arguably below its overall impact in the economy. The sector may be having a moment in the sun: XLE, the energy sector ETF, returned 40% year to date through Q3, according to Koyfin. Demand has defied the 2020 peak-demand consensus, with oil consumption rising through 2025. The IEA now forecasts a 2026 decline tied to the Iran war, a reminder of how hard oil demand is to forecast. Natural gas is supported by LNG exports and data center electricity demand, which the IEA expects to more than double by 2030.
The Syntax Energy Index provides a broader measure of the energy sector than XLE. Taking a deep dive into this expanded opportunity set using Syntax’s revenue-level data, we find that about 76% of Index-weighted revenue comes from three separate parts of the energy value chain, each behaving differently:
- Upstream (29.4%): producers of oil, natural gas, and NGLs whose earnings are the most sensitive to commodity prices.
- Midstream (17.7%): pipelines, processing, storage, and LNG facilities, typically fee-based and tied to volumes.
- Downstream (28.7%): refining, petrochemicals, and distribution. Refining earnings depend on the spread between crude costs and product prices rather than the price of oil itself.
The remaining Index-weighted revenues are primarily Oilfield Services and Oilfield Equipment (14.7% combined), with the balance spread across other sectors, including chemicals, electrical equipment, construction and engineering, and investment banking and broker-dealers.
Energy has outperformed the broad market this year, but the longer record is a reminder of the risk. Since the start of the Energy Index’s backtest, it has trailed the Syntax 3000 Index (11.6% vs. 14.0% annualized) with about twice the volatility, and its rolling 1-year returns have ranged from −59.7% to +129.2%. A moderate correlation of 0.60 can help diversify a portfolio, but a 1.24 beta means the Index has tended to amplify market moves. The Energy sector provides a reminder that investors benefit from understanding what they own as they consider portfolio exposures.
To learn more, please email sgrieco@syntaxdata.com and visit our website https://www.syntaxdata.com/.
Citations:
- PwC Study Prepared for the American Petroleum Institute, October 2025: Contribution of the Oil and Natural Gas Industry to the US Economy in 2023. Study commissioned by the American Petroleum Institute; the 7.4% share reflects 2023 data.
- S&P Dow Jones Indices, S&P 500 sector and constituent weights, as of the end of Q3 2026.
- Fuel Oil News, “bp energy outlook suggests global oil demand may have peaked,” September 28, 2020. The 40% production target comes from BP’s August 4, 2020 strategy announcement; see Offshore, “BP targeting 40% lower oil and gas production by 2030,” August 4, 2020.
- Energy Institute, Statistical Review of World Energy 2026 (June 30, 2026), world oil consumption (crude oil and natural gas liquids): 98.6 million barrels per day in 2019, 89.8 million in 2020 and 103.0 million in 2025. The 2026 decline is from IEA (2026), Oil Market Report - October 2026, IEA, Paris, https://www.iea.org/reports/oil-market-report-october-2026
- World Oil (Bloomberg), “bp announces it will pivot back to oil and gas, cut renewables spending,” February 26, 2025. bp said it would raise oil and gas investment to about $10 billion a year and cut annual low-carbon investment to $1.5 billion to $2 billion.
- IEA (2025), World Energy Outlook 2025, IEA, Paris, https://www.iea.org/reports/world-energy-outlook-2025
- IEA (2025), World Energy Outlook 2025, https://www.iea.org/reports/world-energy-outlook-2025. The Current Policies Scenario LNG figures for 2024 and 2035 are as reported by Reuters, “World Oil and Gas Demand Could Grow Until 2050, IEA Says,” November 12, 2025.
- Preliminary LSEG shipping data, as reported by BNN Bloomberg (January 2, 2026) and Pipeline & Gas Journal (January 2026).
- IEA (2025), World Energy Outlook 2025, executive summary, in the “LNG looking for accommodation” section. https://www.iea.org/reports/world-energy-outlook-2025/executive-summary
- IEA (2025), Energy and AI, executive summary. https://www.iea.org/reports/energy-and-ai/executive-summary
- IEA (2025), Energy and AI, “Energy supply for AI” chapter. https://www.iea.org/reports/energy-and-ai/energy-supply-for-ai
- https://ajovista.com/wp-content/uploads/2022/12/22_12.pdf
- https://www.aarp.org/money/retirement/most-valuable-stocks-by-the-decade/