Get in touch


How advisors can use Syntax Direct to build a large-cap benchmark around a concentrated stock position
Key Takeaways
- Owning a 100-stock capitalization-weighted benchmark portfolio is a concentration decision before any customization is applied. The SY500 100 Index Model, created in Syntax Direct to mimic the performance of the Syntax US LargeCap 500 Index (SY500) with only 100 stocks, demonstrates this concept. At the September 2026 rebalance, the Magnificent Seven (NVIDIA, Apple, Microsoft, Alphabet, Amazon, Meta, and Tesla) made up 43.6% of the SY500 100 Index Model, up from 21.1% in the first backtested basket in December 2017, and NVIDIA sat at the 10% single-stock cap.
- Excluding NVIDIA produced a model that returned 14.99% annualized over the full backtest period (12/15/2017 to 9/18/2026), against 14.78% for the SY500, with tracking error essentially unchanged at 2.6%. The unmodified SY500 100 returned 16.35%, so nearly all of the baseline's excess return over the SY500 came from one stock.
- Removing the Magnificent Seven produced a model that trailed the SY500 by 300 basis points a year over the full period with 5.3% tracking error and 0.88 beta, and its own top-ten weight still rose from 25.0% to 32.3%, because capitalization weighting concentrates whatever universe it is given.
- Measured where it matters, at the level of the client's total equity, the choice of how concentrated to make the 100-stock equity sleeve changes risk materially. For a client holding 20% in NVIDIA, pairing the position with the Technology underweight sleeve instead of the unmodified SY500 100 lowered tracking error against the SY500 from 9.1% to 7.2% over the full period and from 7.7% to 4.6% in 2026, at a cost of about two points of annualized return over a period in which the stock rose 47-fold.
The Advisor Opportunity
Concentrated stock positions arrive in an advisor's book in predictable ways. Equity compensation accumulates over a career at one company, founder shares survive a sale, an inheritance carries a legacy holding, and a long-held winner simply grows into a problem. The tax cost of selling is usually the first conversation, and it deserves its own treatment. This case study addresses the second conversation, which is what to do with the rest of the client's equity allocation while the position is being managed. The conventional answer, a broad-market index fund held alongside the stock, can add to the exposure the client already has too much of, because the largest positions in a capitalization-weighted index are the very names that tend to show up as concentrated holdings.
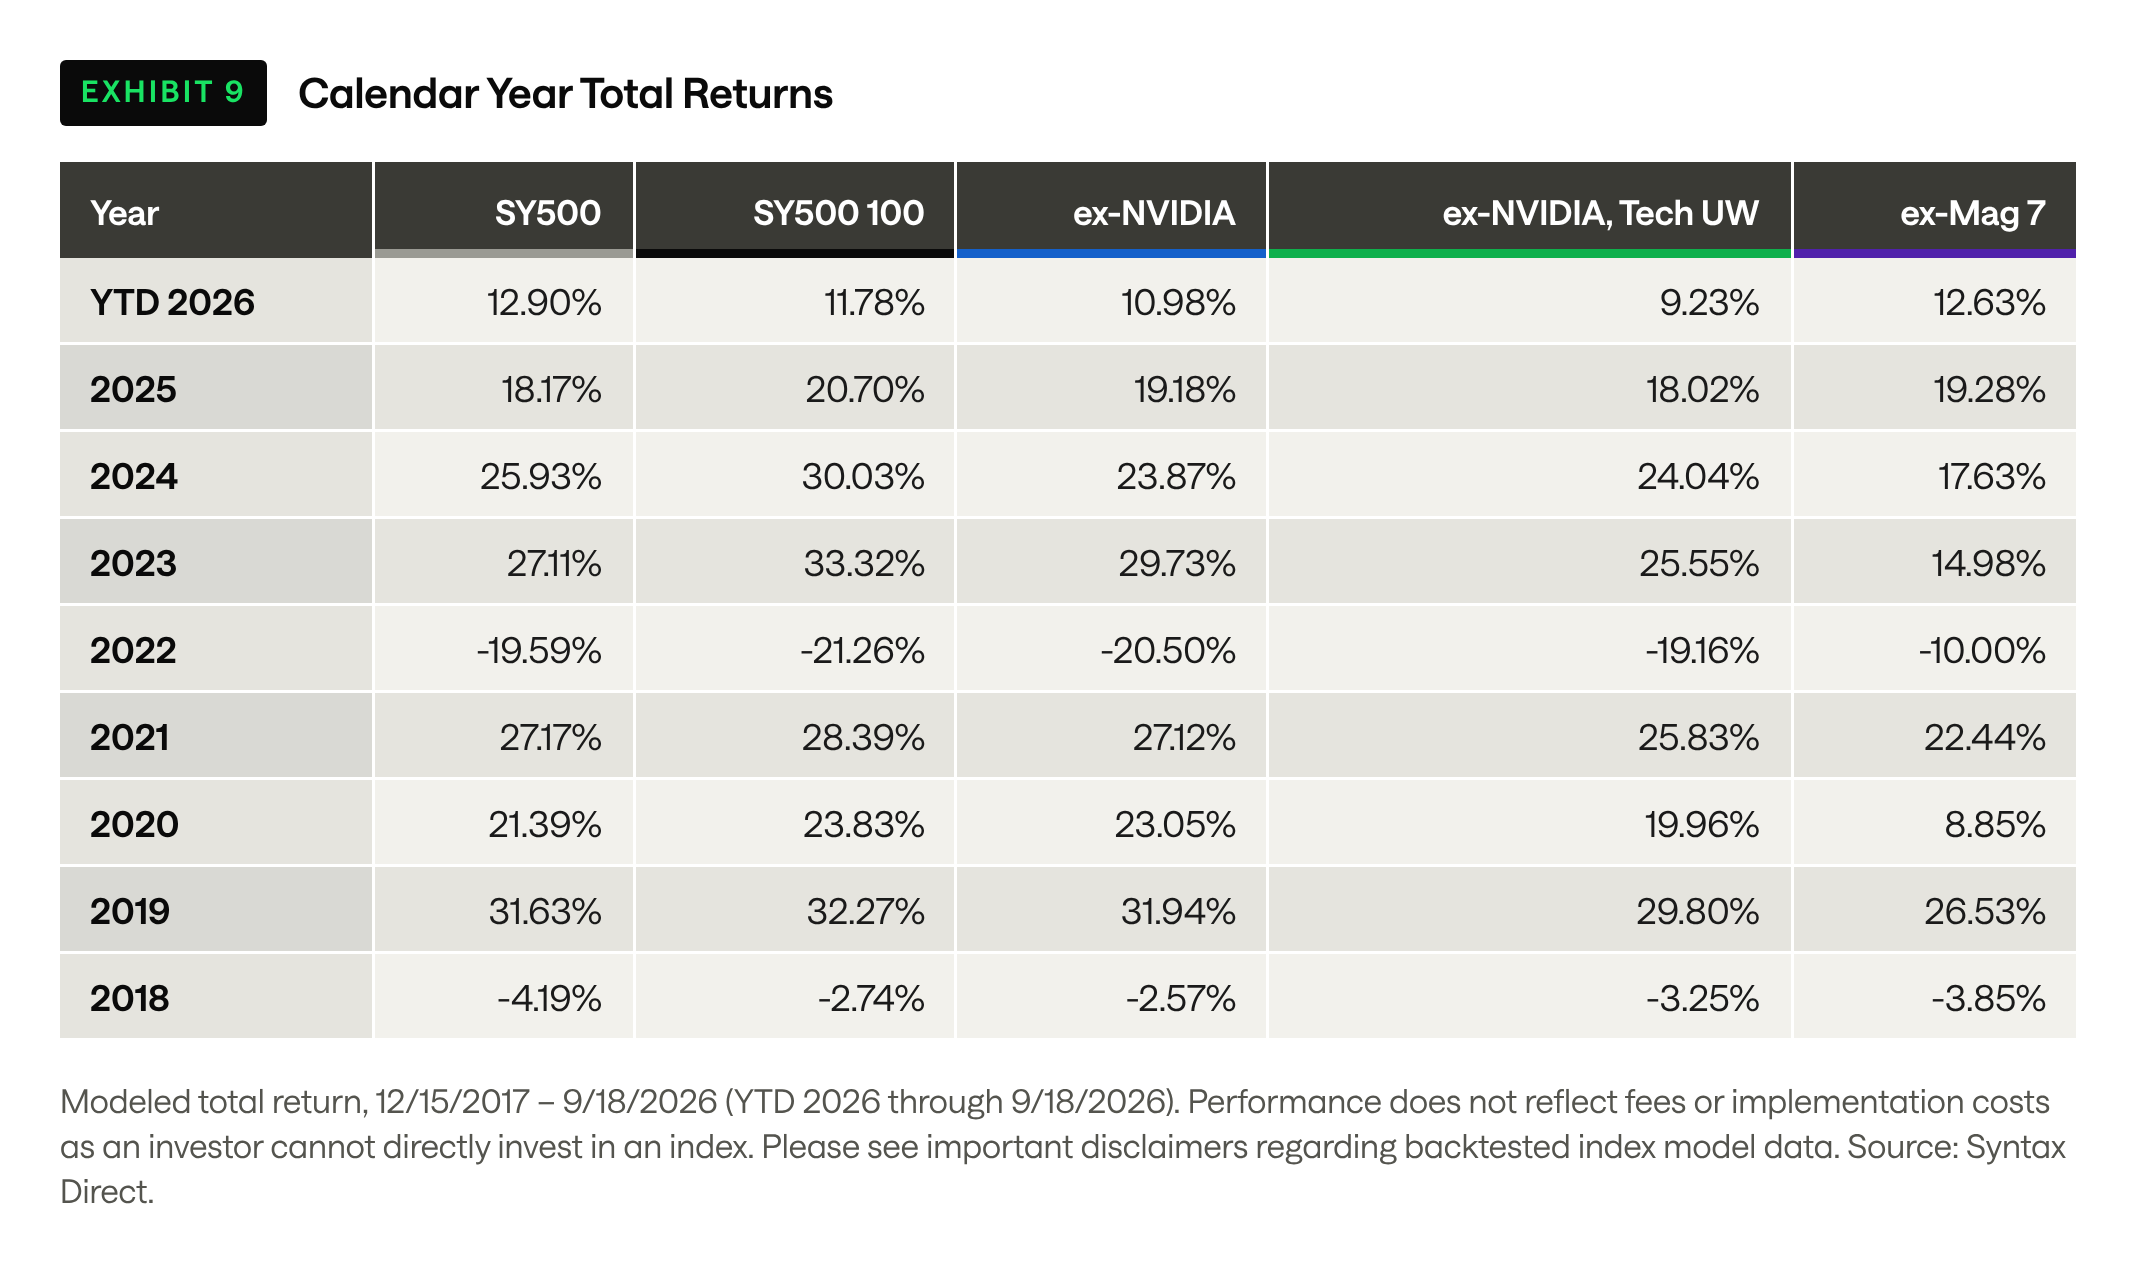
The problem has grown with the market's concentration. At the September 2026 rebalance, the Magnificent Seven accounted for 43.6% of a 100-stock large-cap benchmark index built on Syntax Direct, compared with 21.1% in the first backtested basket in December 2017, and NVIDIA alone sat at the 10% single-stock cap. A client who holds NVIDIA through equity compensation and a plain large-cap benchmark therefore owns the company twice. This year has also reminded advisors that leadership rotates. The SY500 100 beat the SY500 by 6.2, 4.1, and 2.5 percentage points in 2023, 2024, and 2025, and it trails by 1.1 points in 2026 through September 18 as returns broadened beyond the largest names. Indices with explicit technology exclusions have been popular among advisor builds on the platform this year.
A client who holds NVIDIA through equity compensation and a plain large-cap benchmark therefore owns the company twice.
Syntax Direct offers two tools for this situation using the Benchmark tile. First, an advisor can exclude up to 25 specific securities by ticker; second, they can underweight a sector at a chosen conviction level. This case study applies those tools one step at a time to the same 100-stock index so that each change can be measured on its own. The first model is the unmodified SY500 100. The second excludes NVIDIA, the largest weight in the universe and the archetype of the concentrated position in this cycle, although the mechanics apply to any name. The third excludes NVIDIA and underweights Technology at low conviction, so that the sleeve offsets part of the exposure the client holds outside it. The fourth drops the Technology underweight and instead excludes the Magnificent Seven (NVIDIA, Apple, Microsoft, Alphabet, Amazon, Meta, and Tesla), which turns the client-level question into an index-level one and extends Syntax's October 2024 analysis of the Magnificent Seven's share of market returns to the 100-stock index that advisors actually deploy.
Building the Index in Syntax Direct
Syntax Direct organizes index construction around a small set of strategy tiles, and the Benchmark tile is the starting point for a large-cap benchmark with exclusions or sector tilts. All four models start from the same questionnaire selections, which Exhibit 1 summarizes. The universe is the Syntax US LargeCap 500 Index (SY500), the target count is 100 holdings, the weighting is modified market capitalization, and no factor, macro, impact, or ESG overlay is applied.
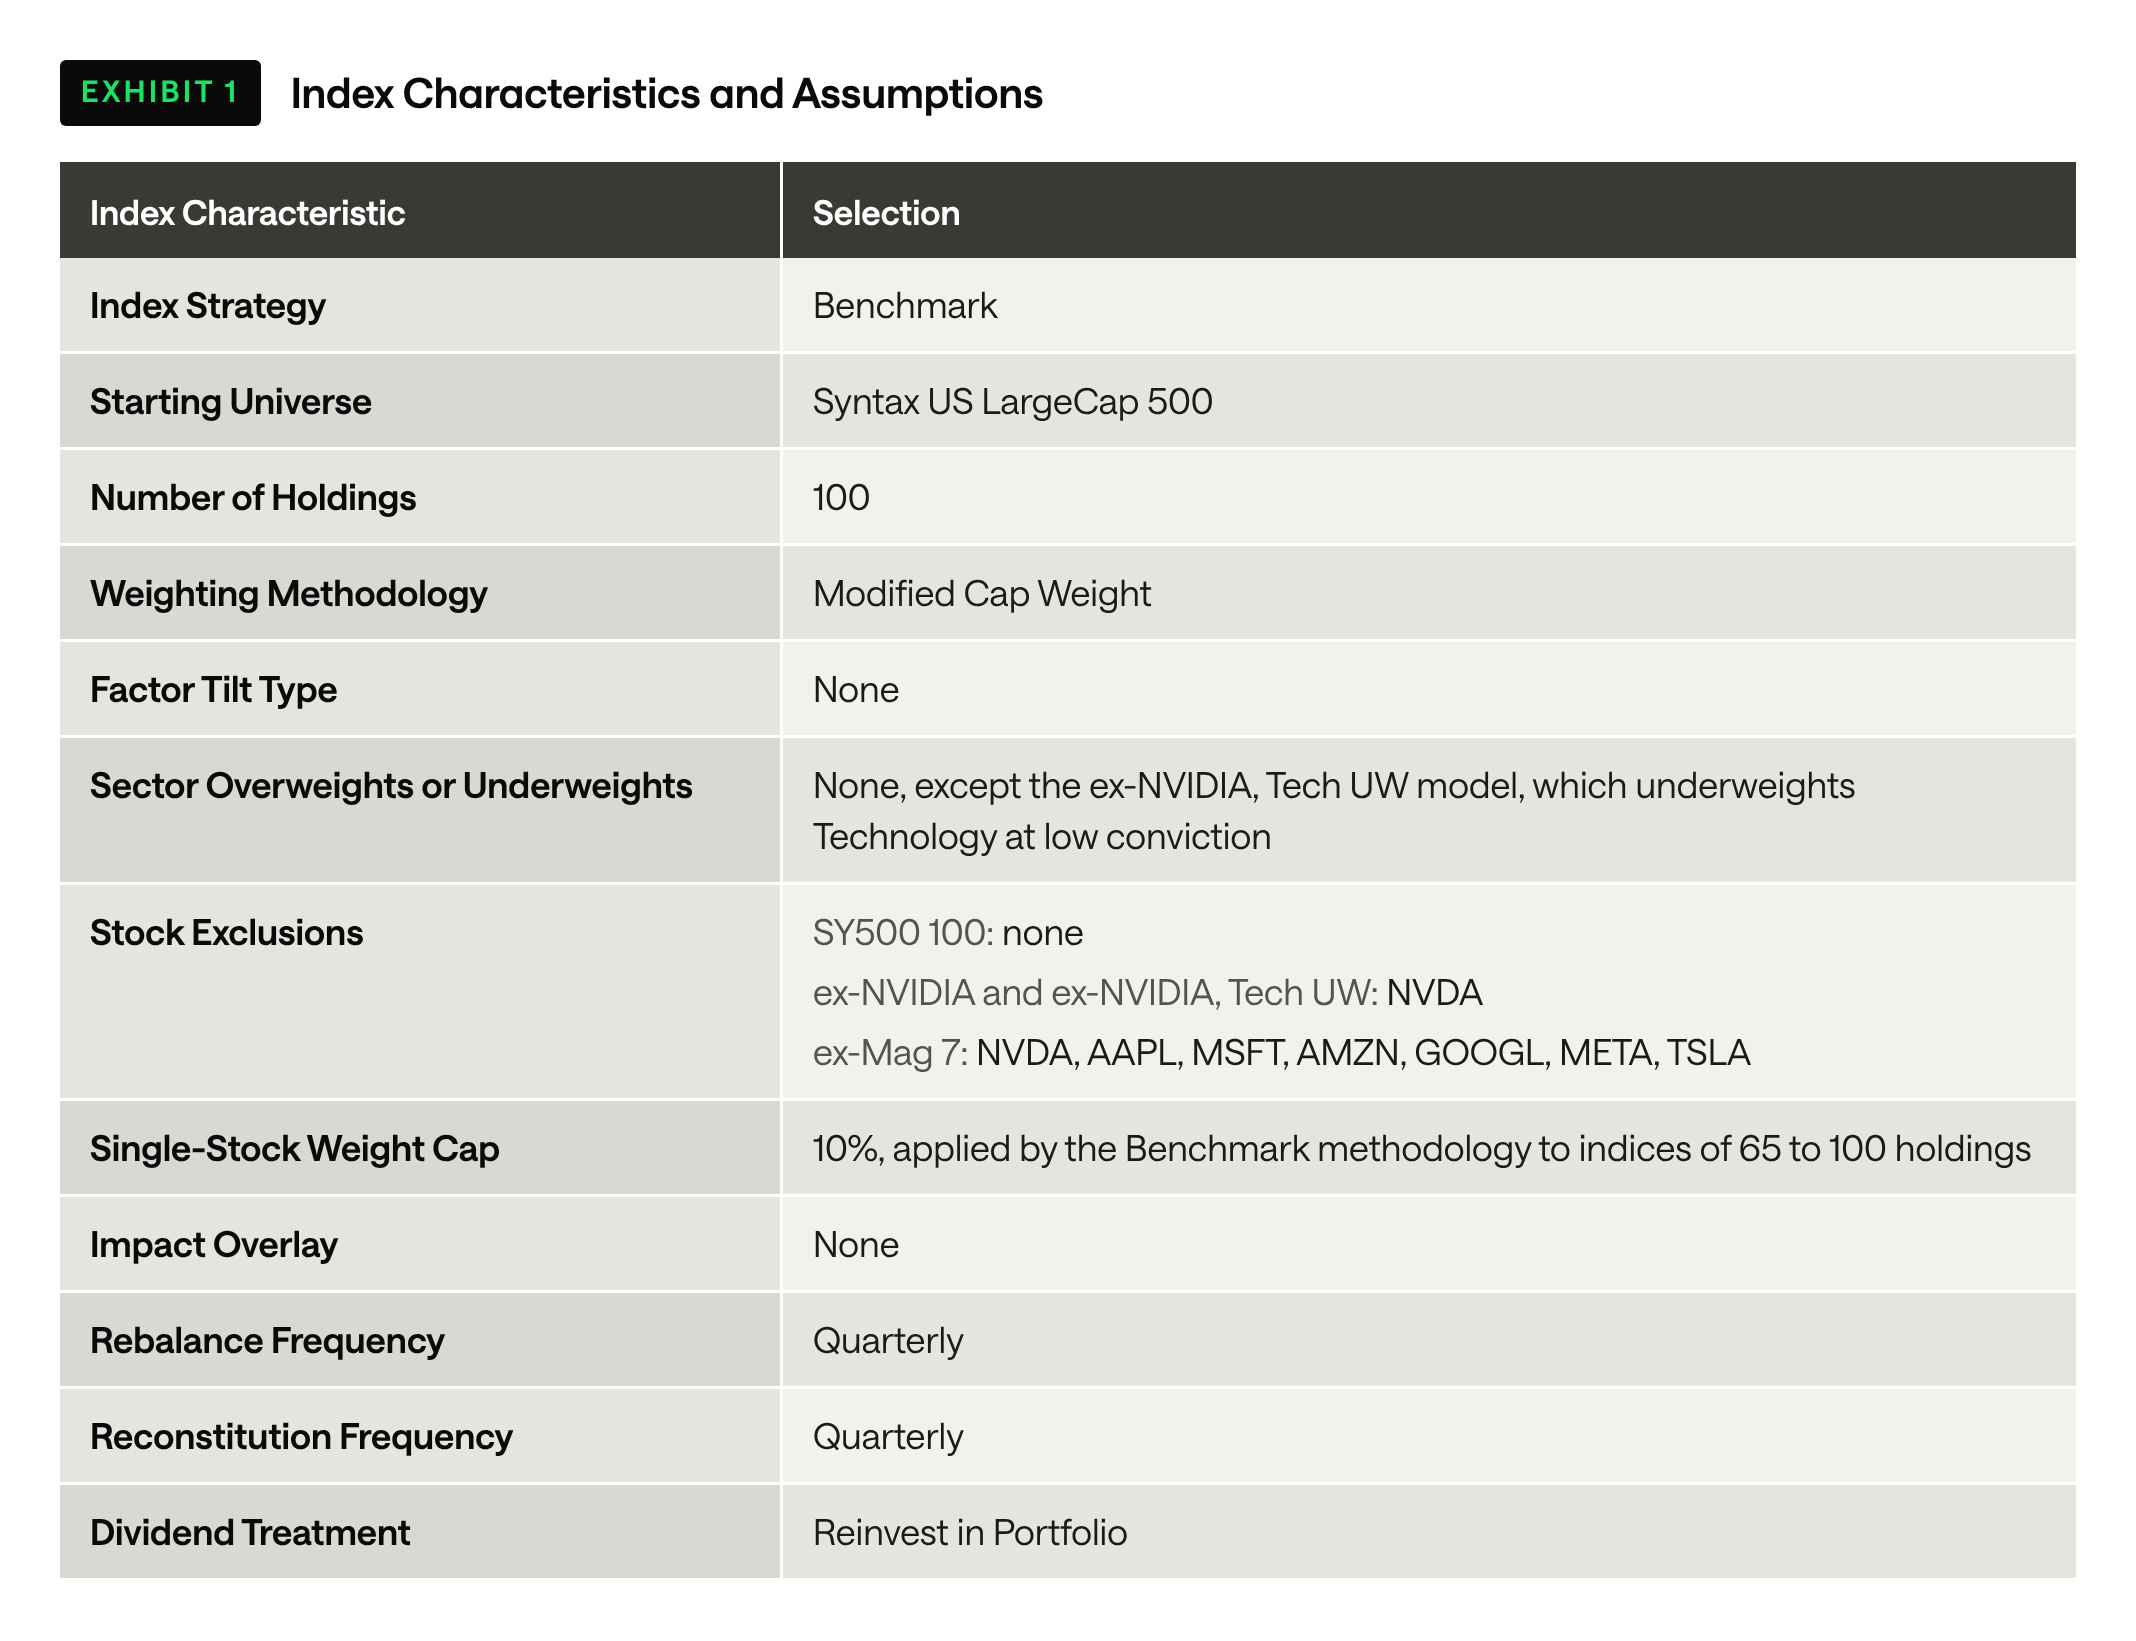
The Benchmark tile selects every stock in the universe at its SY500 weight, ranks the list by weight, deletes everything below rank 100, redistributes the remaining weight pro rata, and applies a single-stock cap that depends on the holding count, which is 10% for an index of 65 to 100 names. The result is the 100 largest companies in the universe, weighted by size and capped, reconstituted and rebalanced quarterly on the third Friday of March, June, September, and December. Exclusions and tilts enter before the ranking step, and that ordering determines how the models behave. When NVIDIA is excluded, its weight is redistributed to the remaining holdings in proportion to their size, so the largest names absorb the most, Apple moves to the 10% cap, and the company that was previously 101st, Altria, enters at rank 100. The low-conviction Technology underweight scales down the weight of every Technology constituent by a factor tied to the sector's share of the universe before the exclusion and ranking steps run, and at the September 2026 rebalance the Hardware constituents were scaled to roughly 80% of their pre-tilt weight. Because the scaling happens ahead of the cut to 100 names, the smallest Technology constituents can fall out of the index and be replaced by companies from other sectors. At the September rebalance that exchange removed Salesforce, Dell, Corning, and ServiceNow and admitted Lowe's, Marathon Petroleum, BNY, and Valero. Exhibit 2 shows where NVIDIA's ten points of weight went when it was excluded.
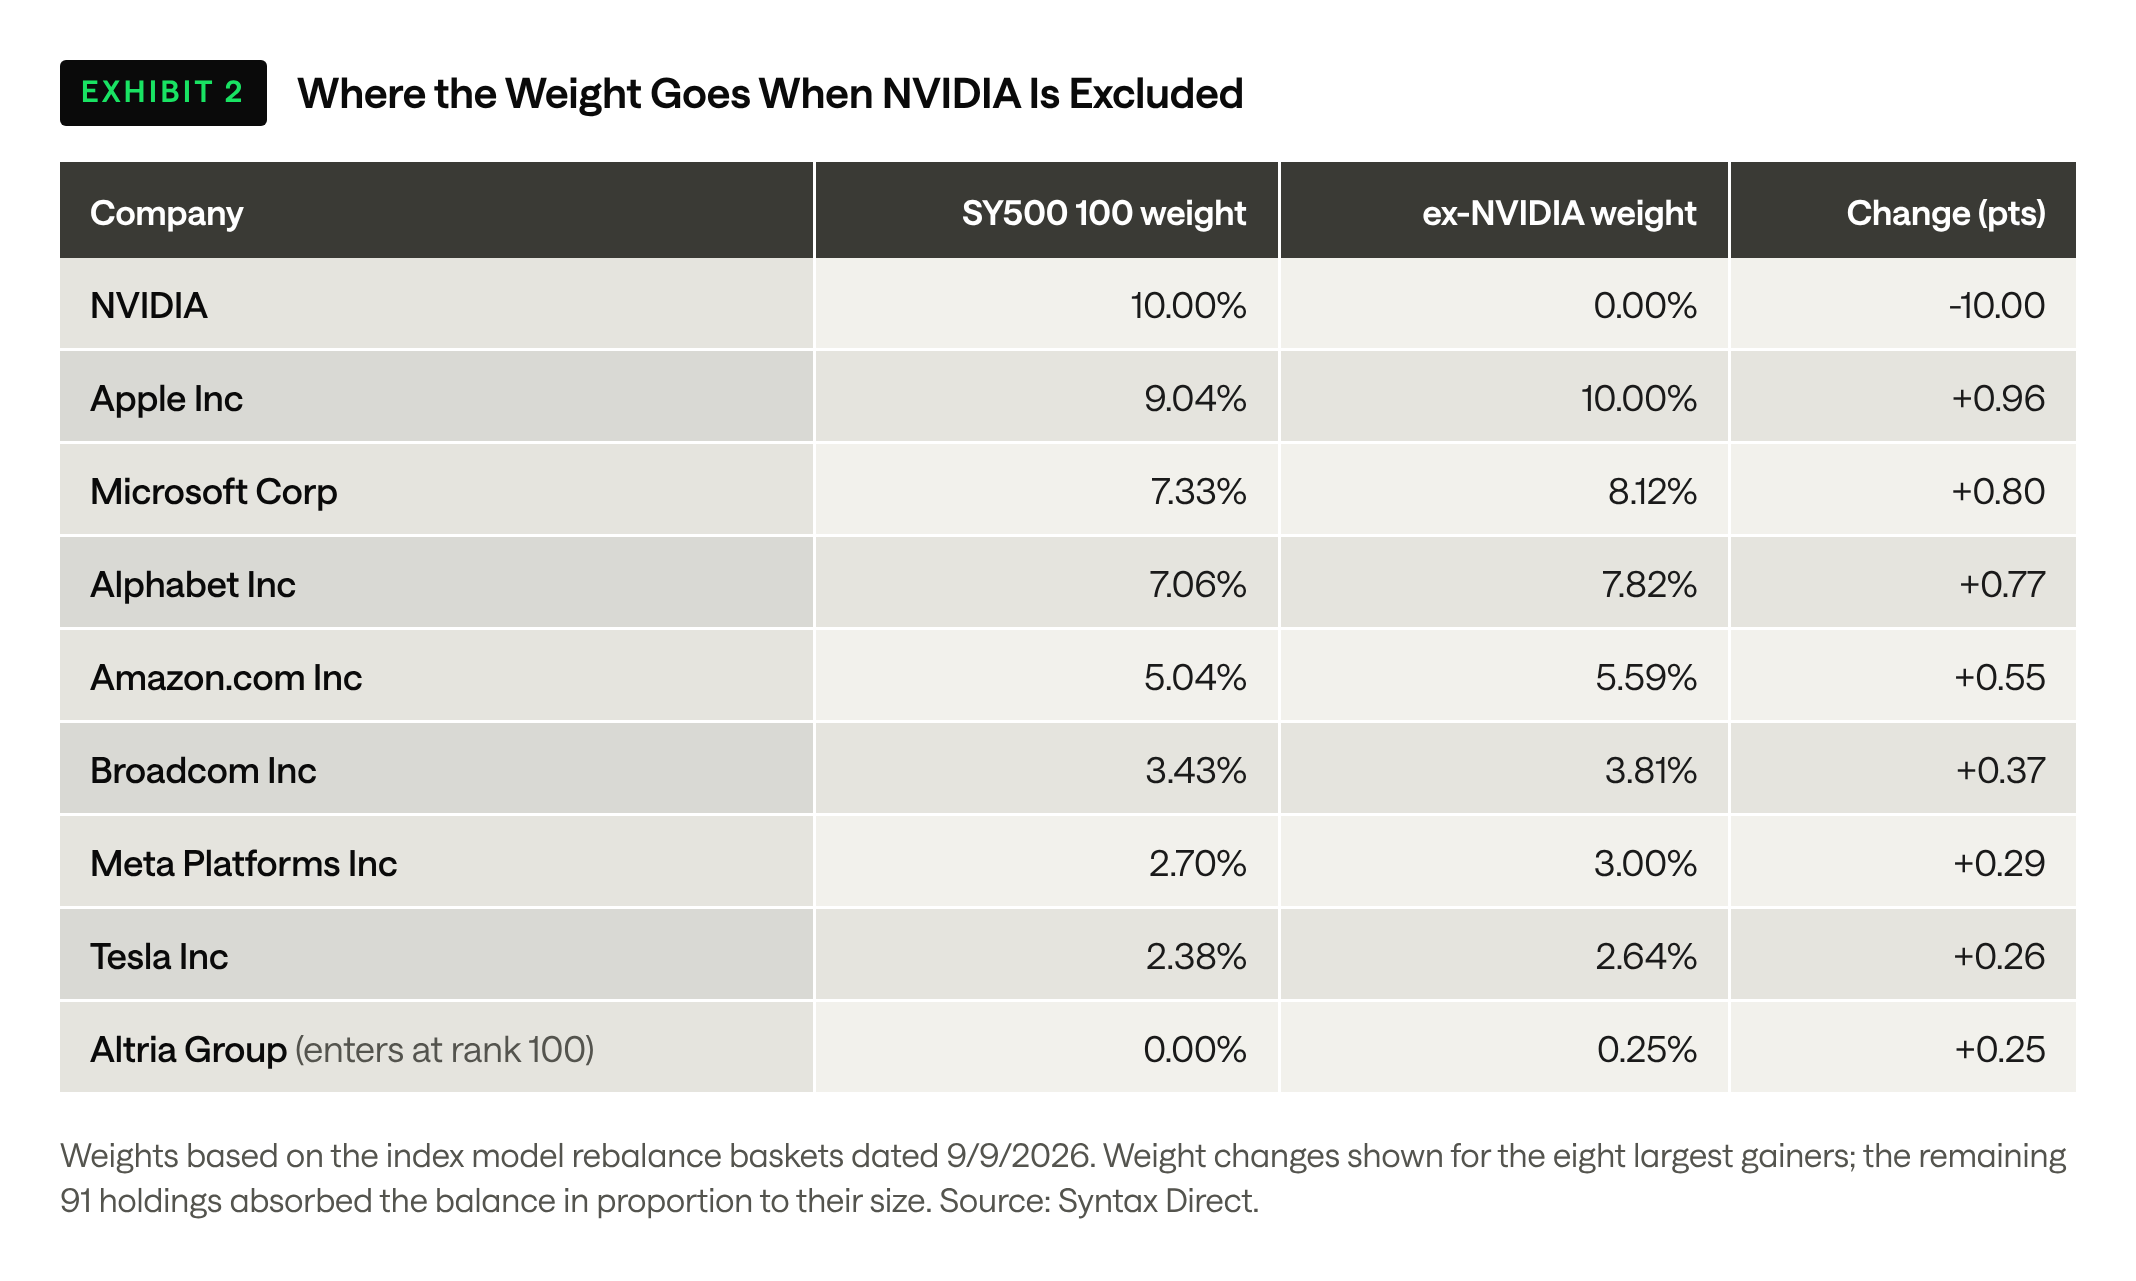
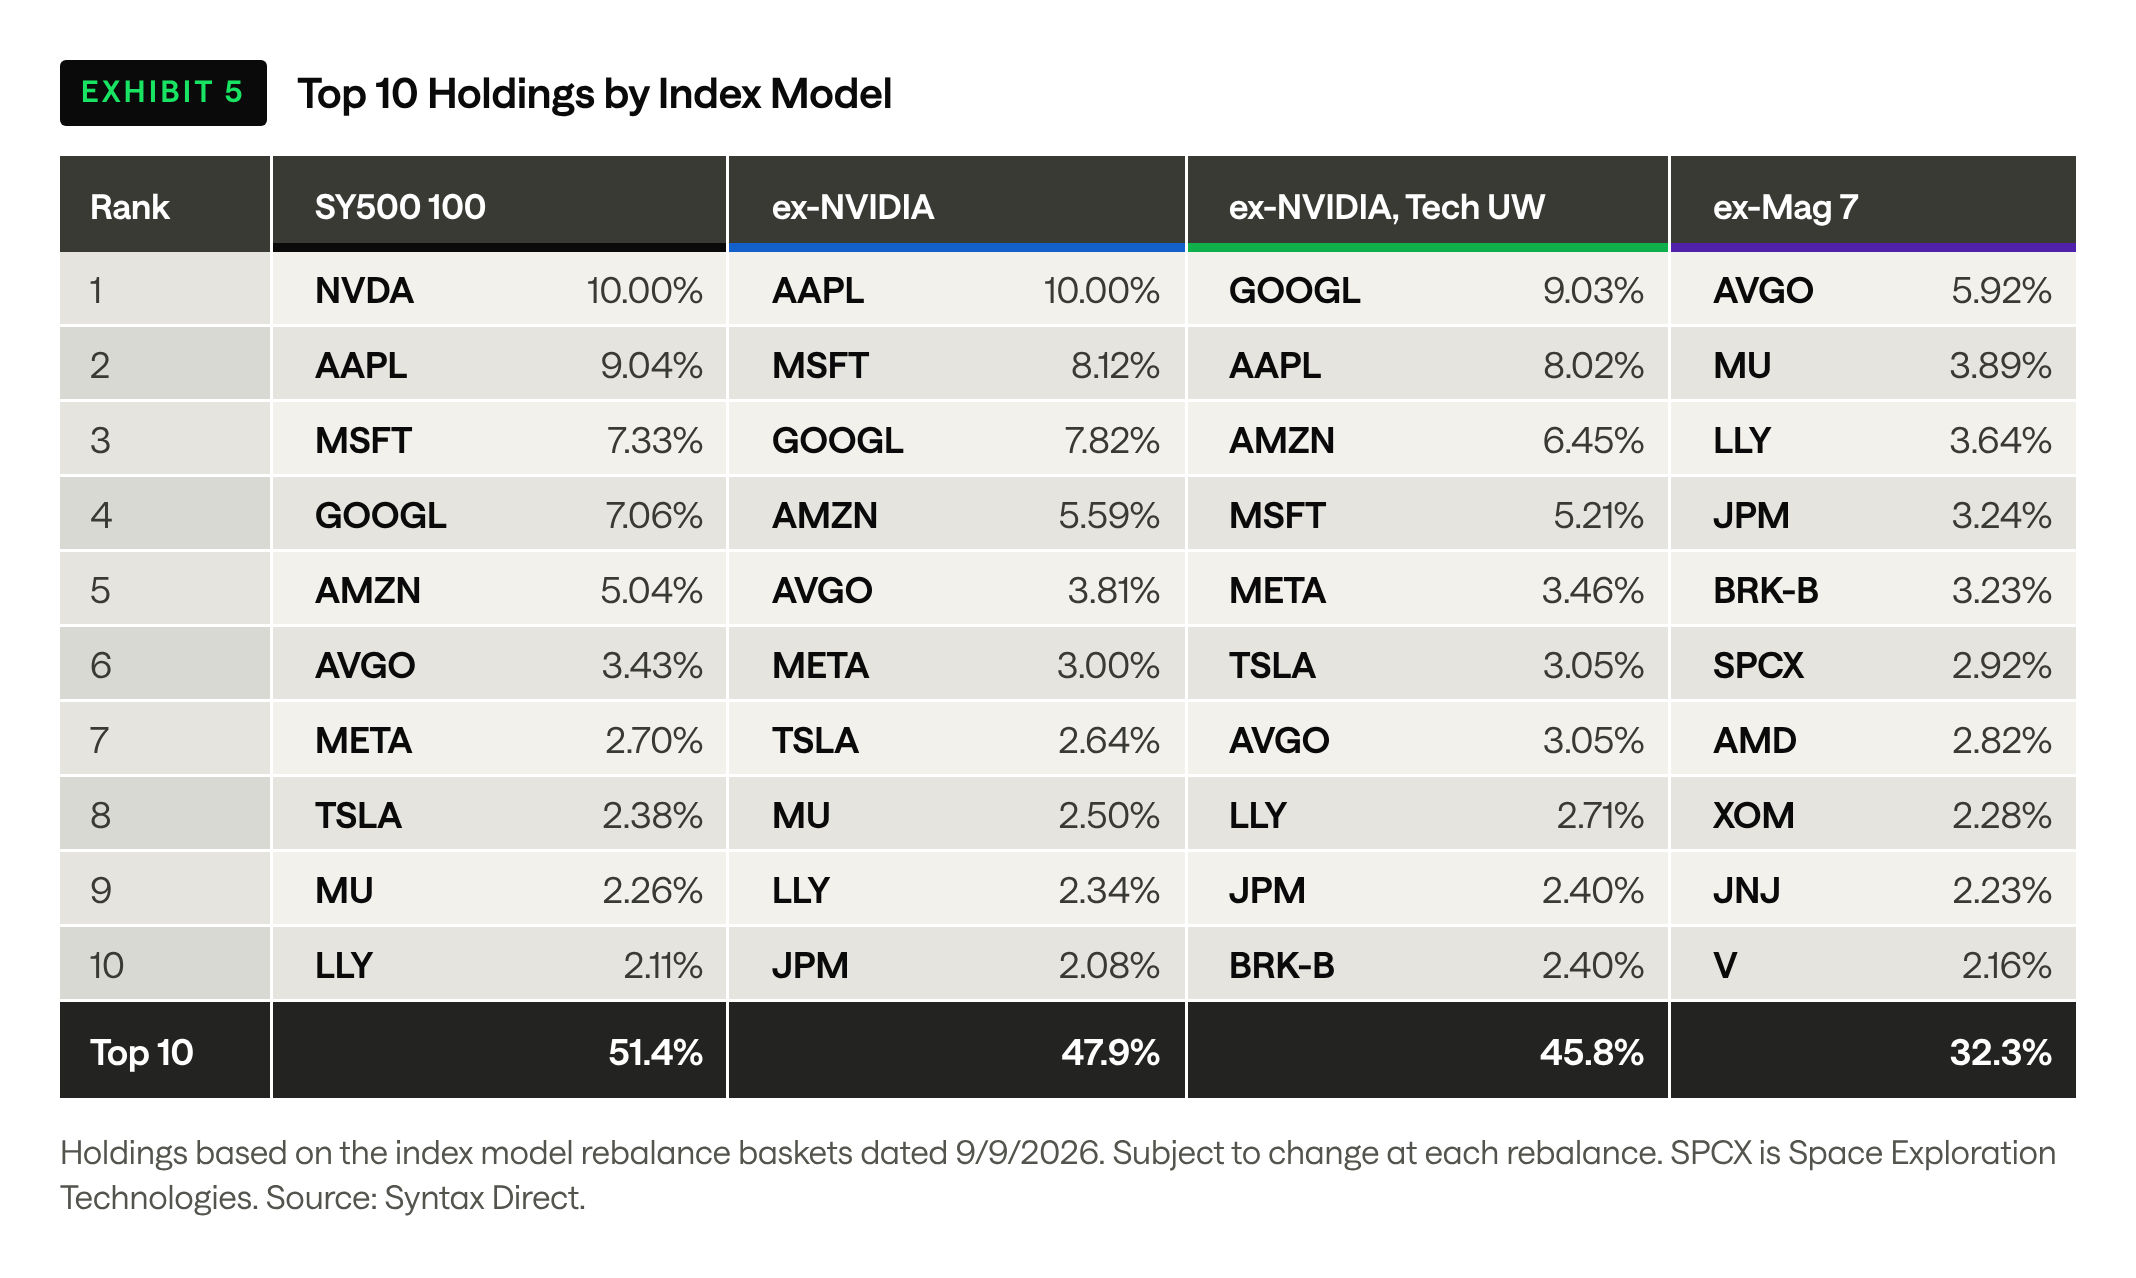
Of NVIDIA's ten points, the other six Magnificent Seven names absorbed 3.6, with Apple moving from 9.04% to the 10% cap and Microsoft, Alphabet, and Amazon each gaining more than half a point. Altria entered at 0.25%. Removing the Magnificent Seven works the same way at larger scale. Broadcom rose from 3.43% to 5.92%, Micron from 2.26% to 3.89%, and Eli Lilly, JPMorgan Chase, and Berkshire Hathaway each moved above 3%, while Altria, Lowe's, Snowflake, Marathon Petroleum, Vertiv, BNY, and Valero entered at the bottom of the list. A capitalization-weighted index does not send excluded weight to the sectors that are under-represented. It sends the weight to the next-largest companies.
Sector Exposures
Exhibit 3 compares the sector weights of the three completion sleeves against the SY500 as of the most recent rebalance, and Exhibit 4 adds the ex-Magnificent Seven model and the three Technology sub-sectors that drive the differences.
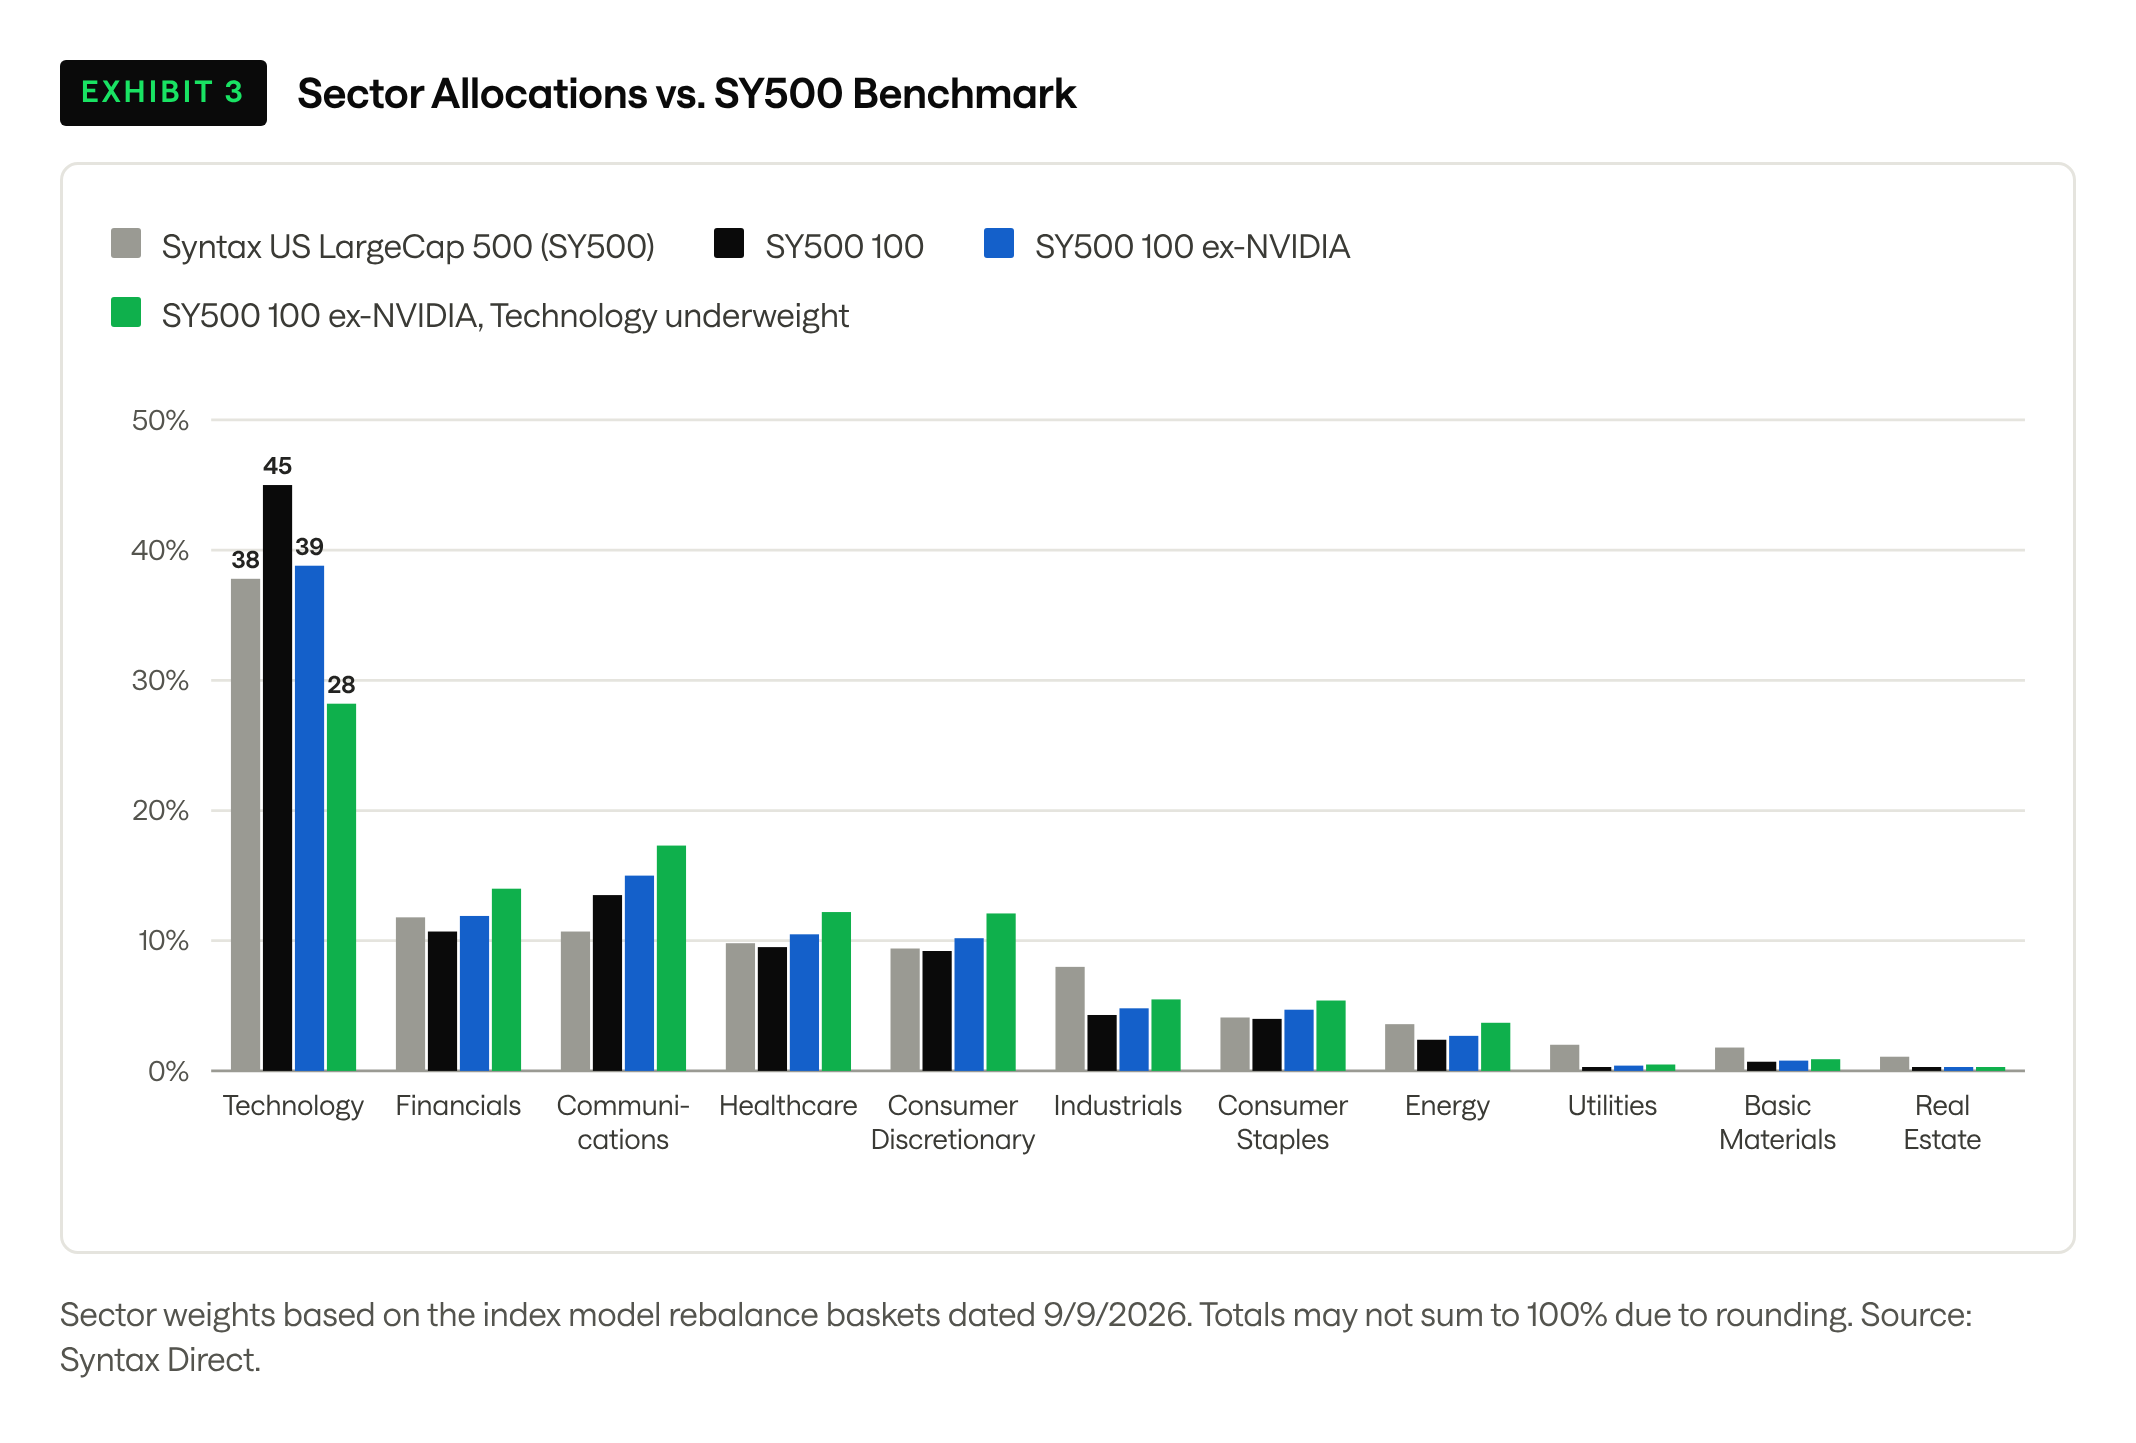
The unmodified SY500 100 is more concentrated than its parent in every dimension that matters here. Technology is 45.0% of the model against 37.8% of the SY500, and the Hardware sub-sector, which holds NVIDIA, Apple, Broadcom, Micron, and AMD in Syntax's classification, is 34.3% against 27.9%. Industrials, Utilities, and Real Estate are a fraction of their SY500 weights because the cut to 100 names removes most of their constituents. The smallest company in the model has a market capitalization of $114 billion, compared with $13.5 billion in the SY500, and the weighted-average market capitalization is $1.94 trillion against $1.47 trillion.
Excluding NVIDIA alone brings Technology to 38.8%, within a point of the SY500, and takes Hardware slightly below it at 26.9%. Communications becomes the largest overweight at 15.0% against 10.7%, because Alphabet and Meta absorbed a share of the redistributed weight and because SpaceX, classified under Telecommunications, carries 1.9% of the model. The Technology underweight then takes the sector to 28.2%, nearly ten points below the SY500, with Hardware at 21.1% and Software and Services at 7.1%. The freed weight is spread across every other sector in proportion to size, so Communications rises to 17.3%, Financials to 14.0%, and Healthcare to 12.2%. The sleeve is deliberately underweight the sector the client already owns through the concentrated position, and it should be judged on the combined portfolio rather than on its own.
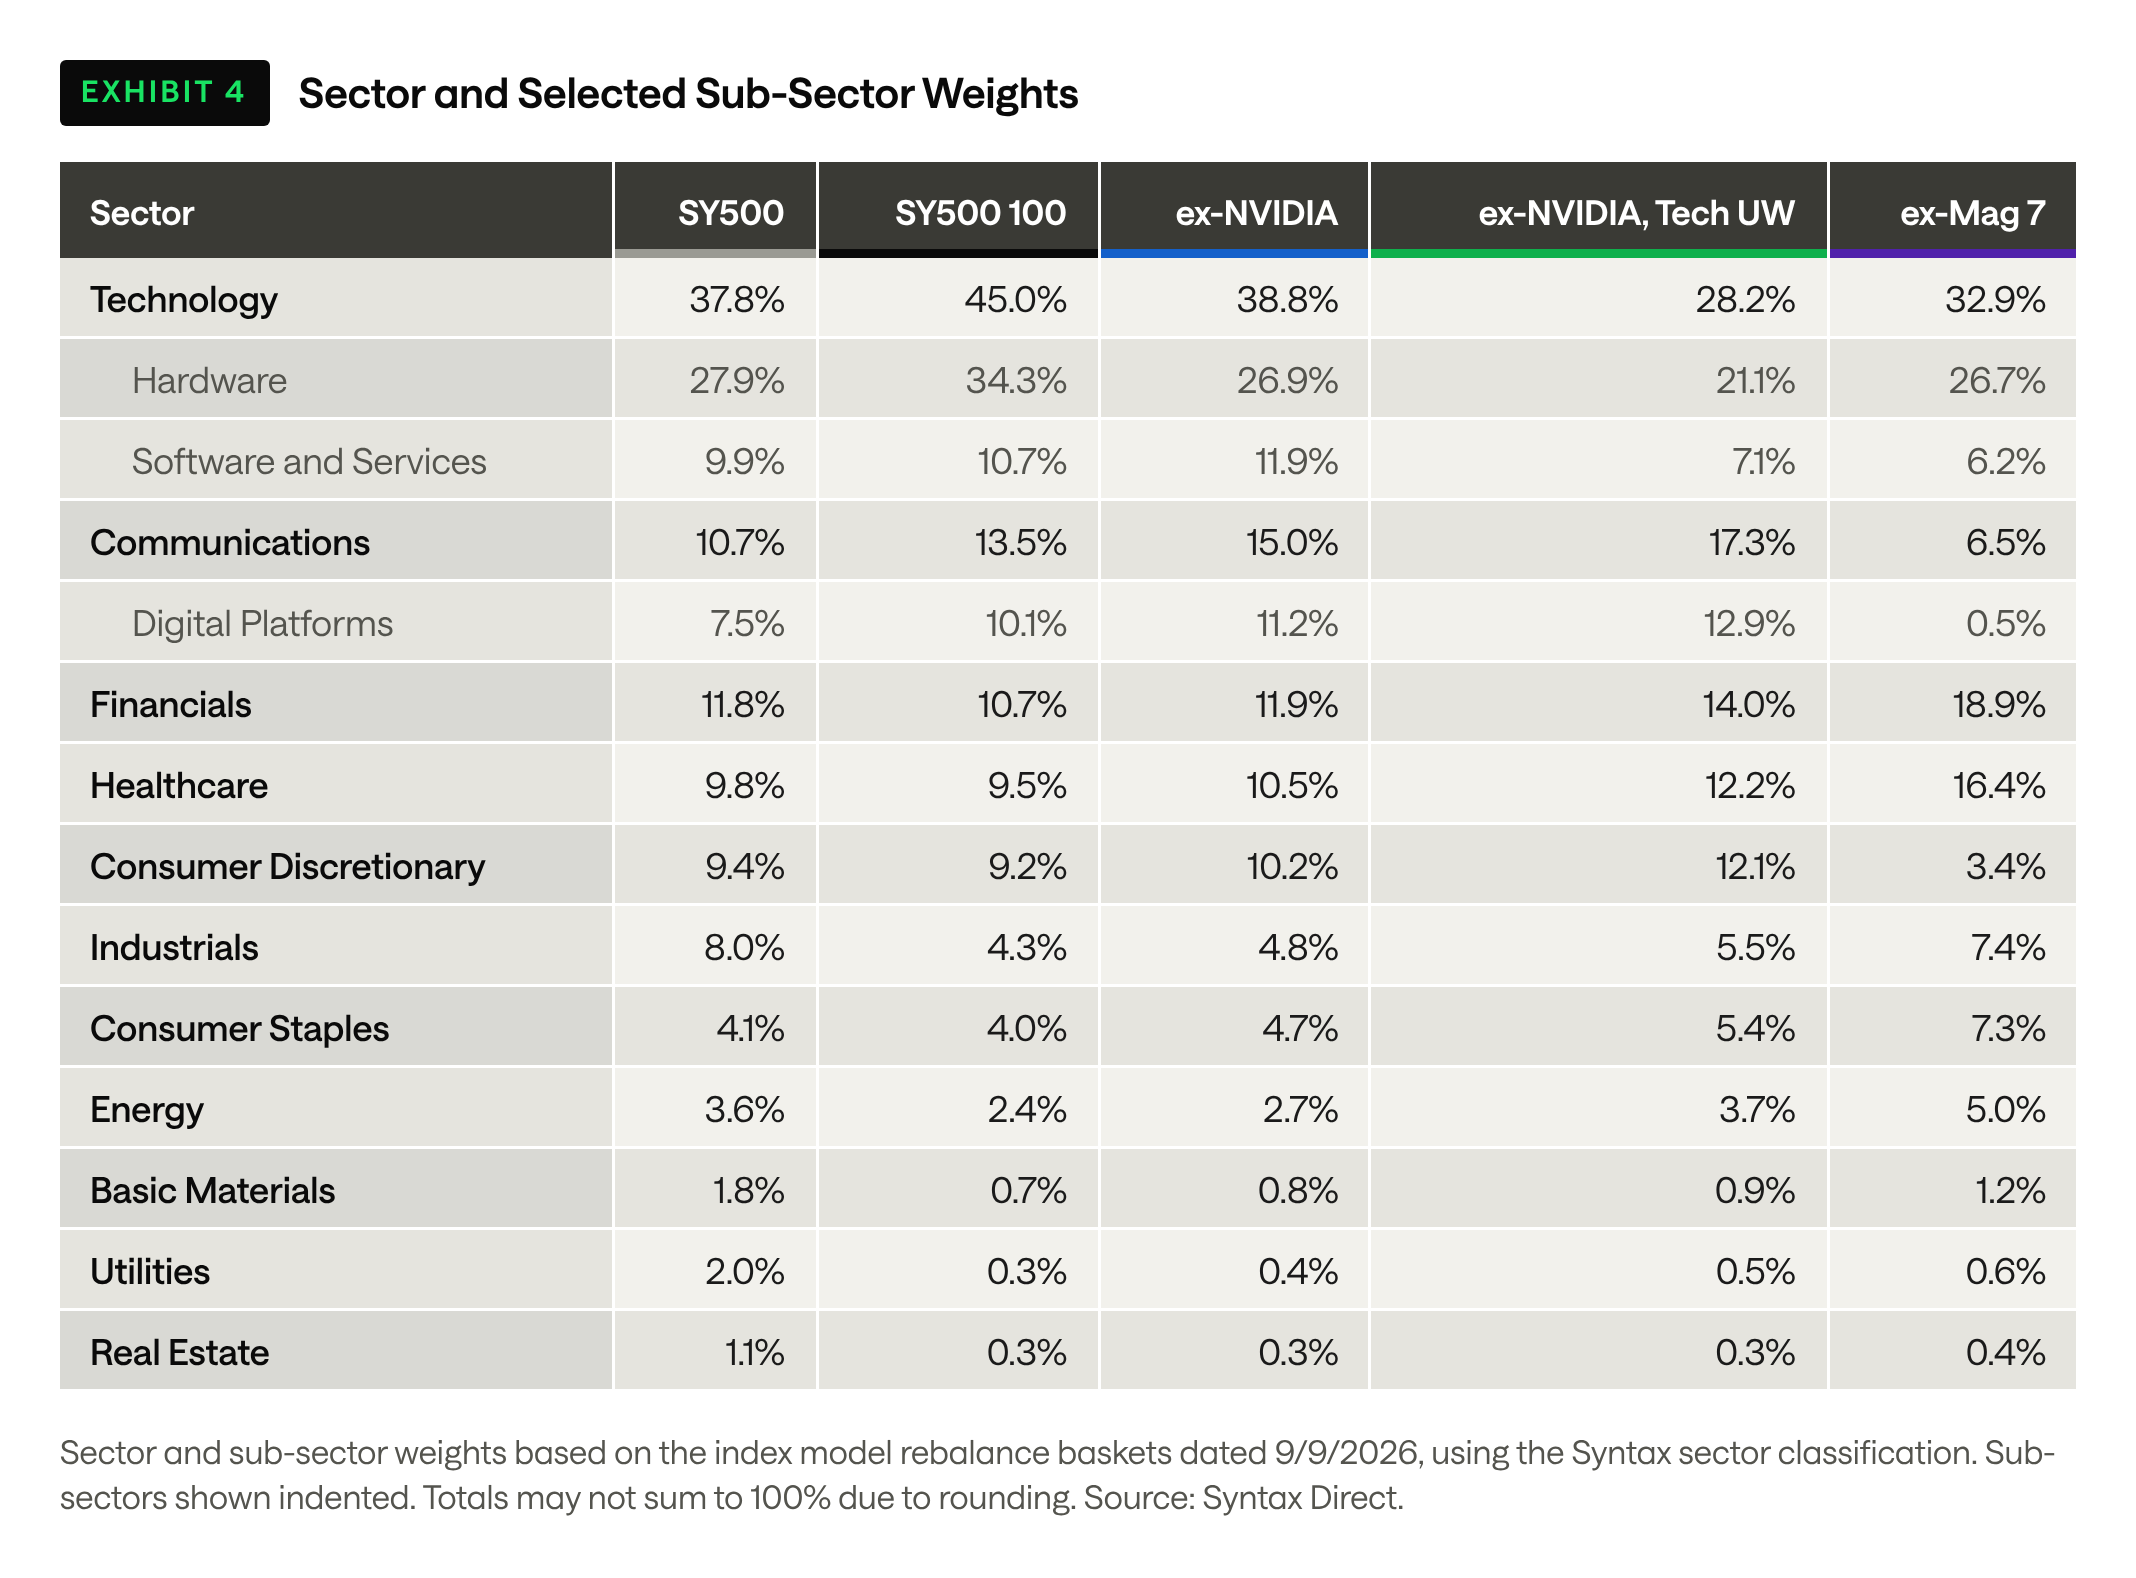
Removing the Magnificent Seven produces a different shape. Technology falls only to 32.9%, because Broadcom, Micron, AMD, and the semiconductor equipment makers absorb much of the weight and Hardware ends up close to neutral at 26.7%. The reductions land instead in Communications, at 6.5% against 10.7% once Alphabet and Meta are gone, and in Consumer Discretionary, at 3.4% against 9.4% without Amazon and Tesla. Financials rises to 18.9% and Healthcare to 16.4%, led by JPMorgan Chase, Berkshire Hathaway, Eli Lilly, and Johnson & Johnson. An advisor who removes the Magnificent Seven to reduce technology exposure will find that the model remains a large-cap semiconductor and pharmaceutical portfolio with a financials tilt.
Top 10 Holdings
Exhibit 5 lists the ten largest constituents of each model as of the most recent rebalance. The 10% cap sets the largest position in the first two models. NVIDIA holds it in the SY500 100 and Apple inherits it once NVIDIA is excluded, so the client's largest sleeve position is determined by the cap rather than by the market in both cases. In the Technology underweight model, Alphabet becomes the largest holding at 9.03% and Apple falls to 8.02%, with Amazon third at 6.45% and Microsoft fourth at 5.21%. The top ten names hold 51.4% of the SY500 100, 47.9% of the ex-NVIDIA model, and 45.8% of the underweight model, so the two customization steps together remove about five and a half points of top-ten concentration while keeping the same familiar names at the head of the list. In the ex-Magnificent Seven model the largest holding is Broadcom at 5.92%, followed by Micron at 3.89% and Eli Lilly at 3.64%, and the top ten hold 32.3%.
Concentration Over Time
Exhibit 6 traces the top-ten weight of each model across the 36 quarterly rebalance baskets in the backtest, together with the Magnificent Seven's share of the SY500 100.
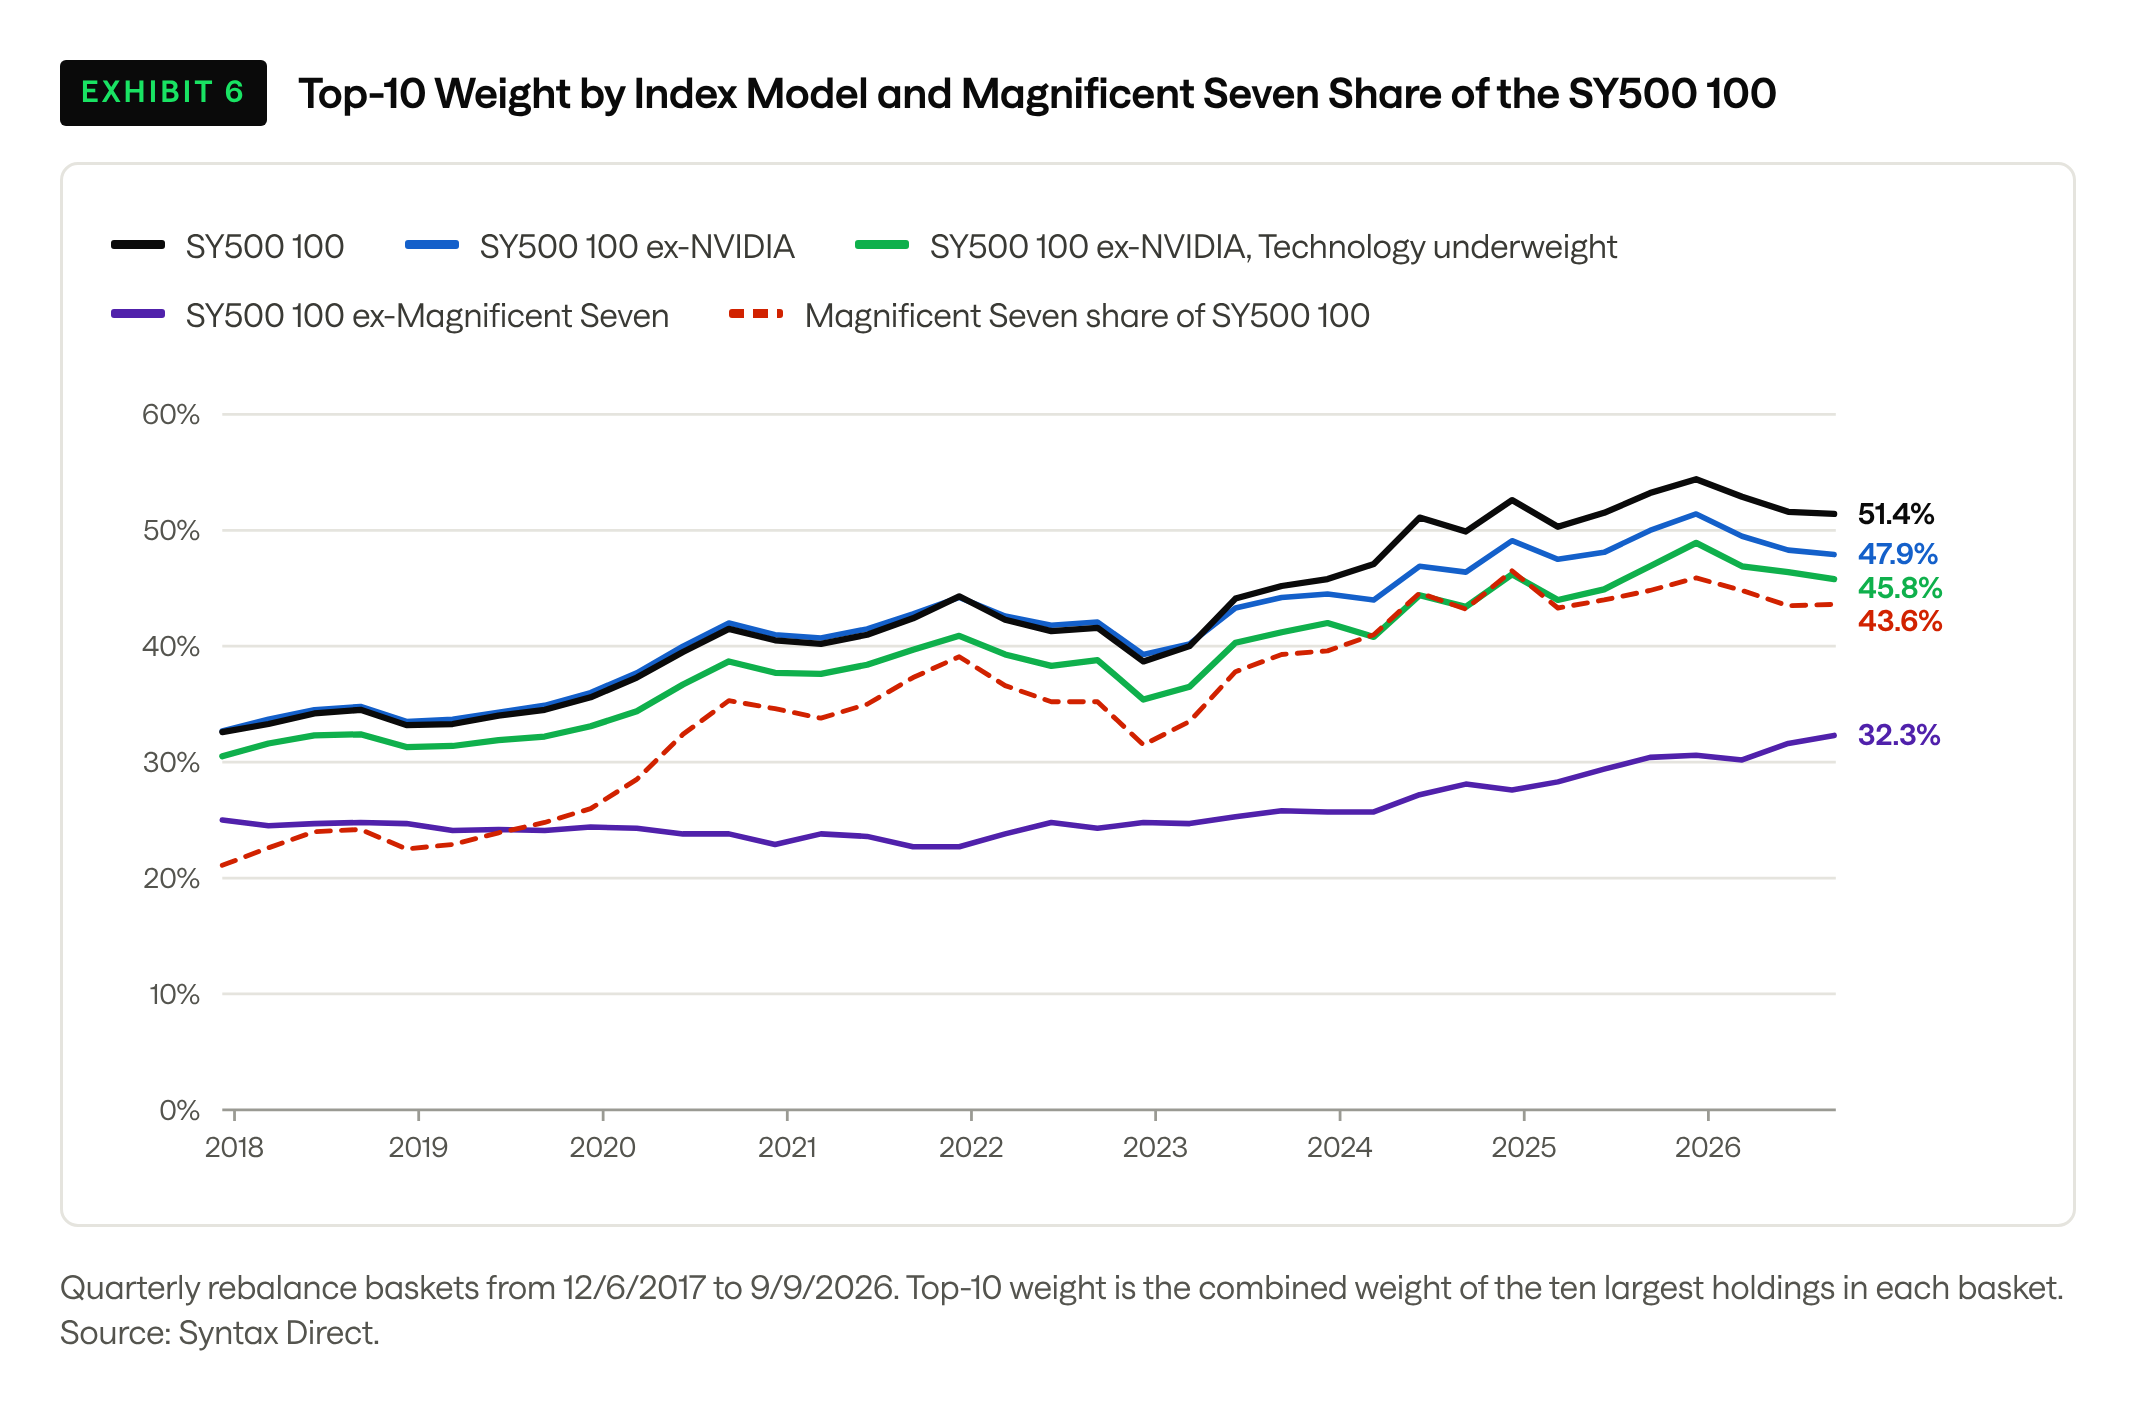
The concentration problem is a recent one and it has not reversed. In the December 2017 basket the top ten names were 32.6% of the SY500 100 and the Magnificent Seven were 21.1%. Both measures climbed through the pandemic to 44.3% and 39.1% in December 2021, fell back in 2022, and then rose to 54.4% and 45.9% in December 2025 as NVIDIA went from 0.7% of the model to the 10% cap. The September 2026 basket stands at 51.4% and 43.6%, three points below the peak but still far above any earlier reading. Excluding NVIDIA lowers the top-ten line by three to four points in recent baskets, and the Technology underweight lowers it by another two to three, so neither step changes the shape of the trend. The ex-Magnificent Seven model's own top-ten weight rose from 25.0% to 32.3% over the same period, driven by Broadcom, Micron, and Eli Lilly, which shows that capitalization weighting concentrates whatever universe it is given.
Backtested Performance
Syntax Direct calculates backtests for indices modeled on the platform beginning on December 15, 2017. Exhibit 7 shows the hypothetical growth of $1,000 invested in each of the four index models and the SY500 from backtest inception through September 18, 2026.
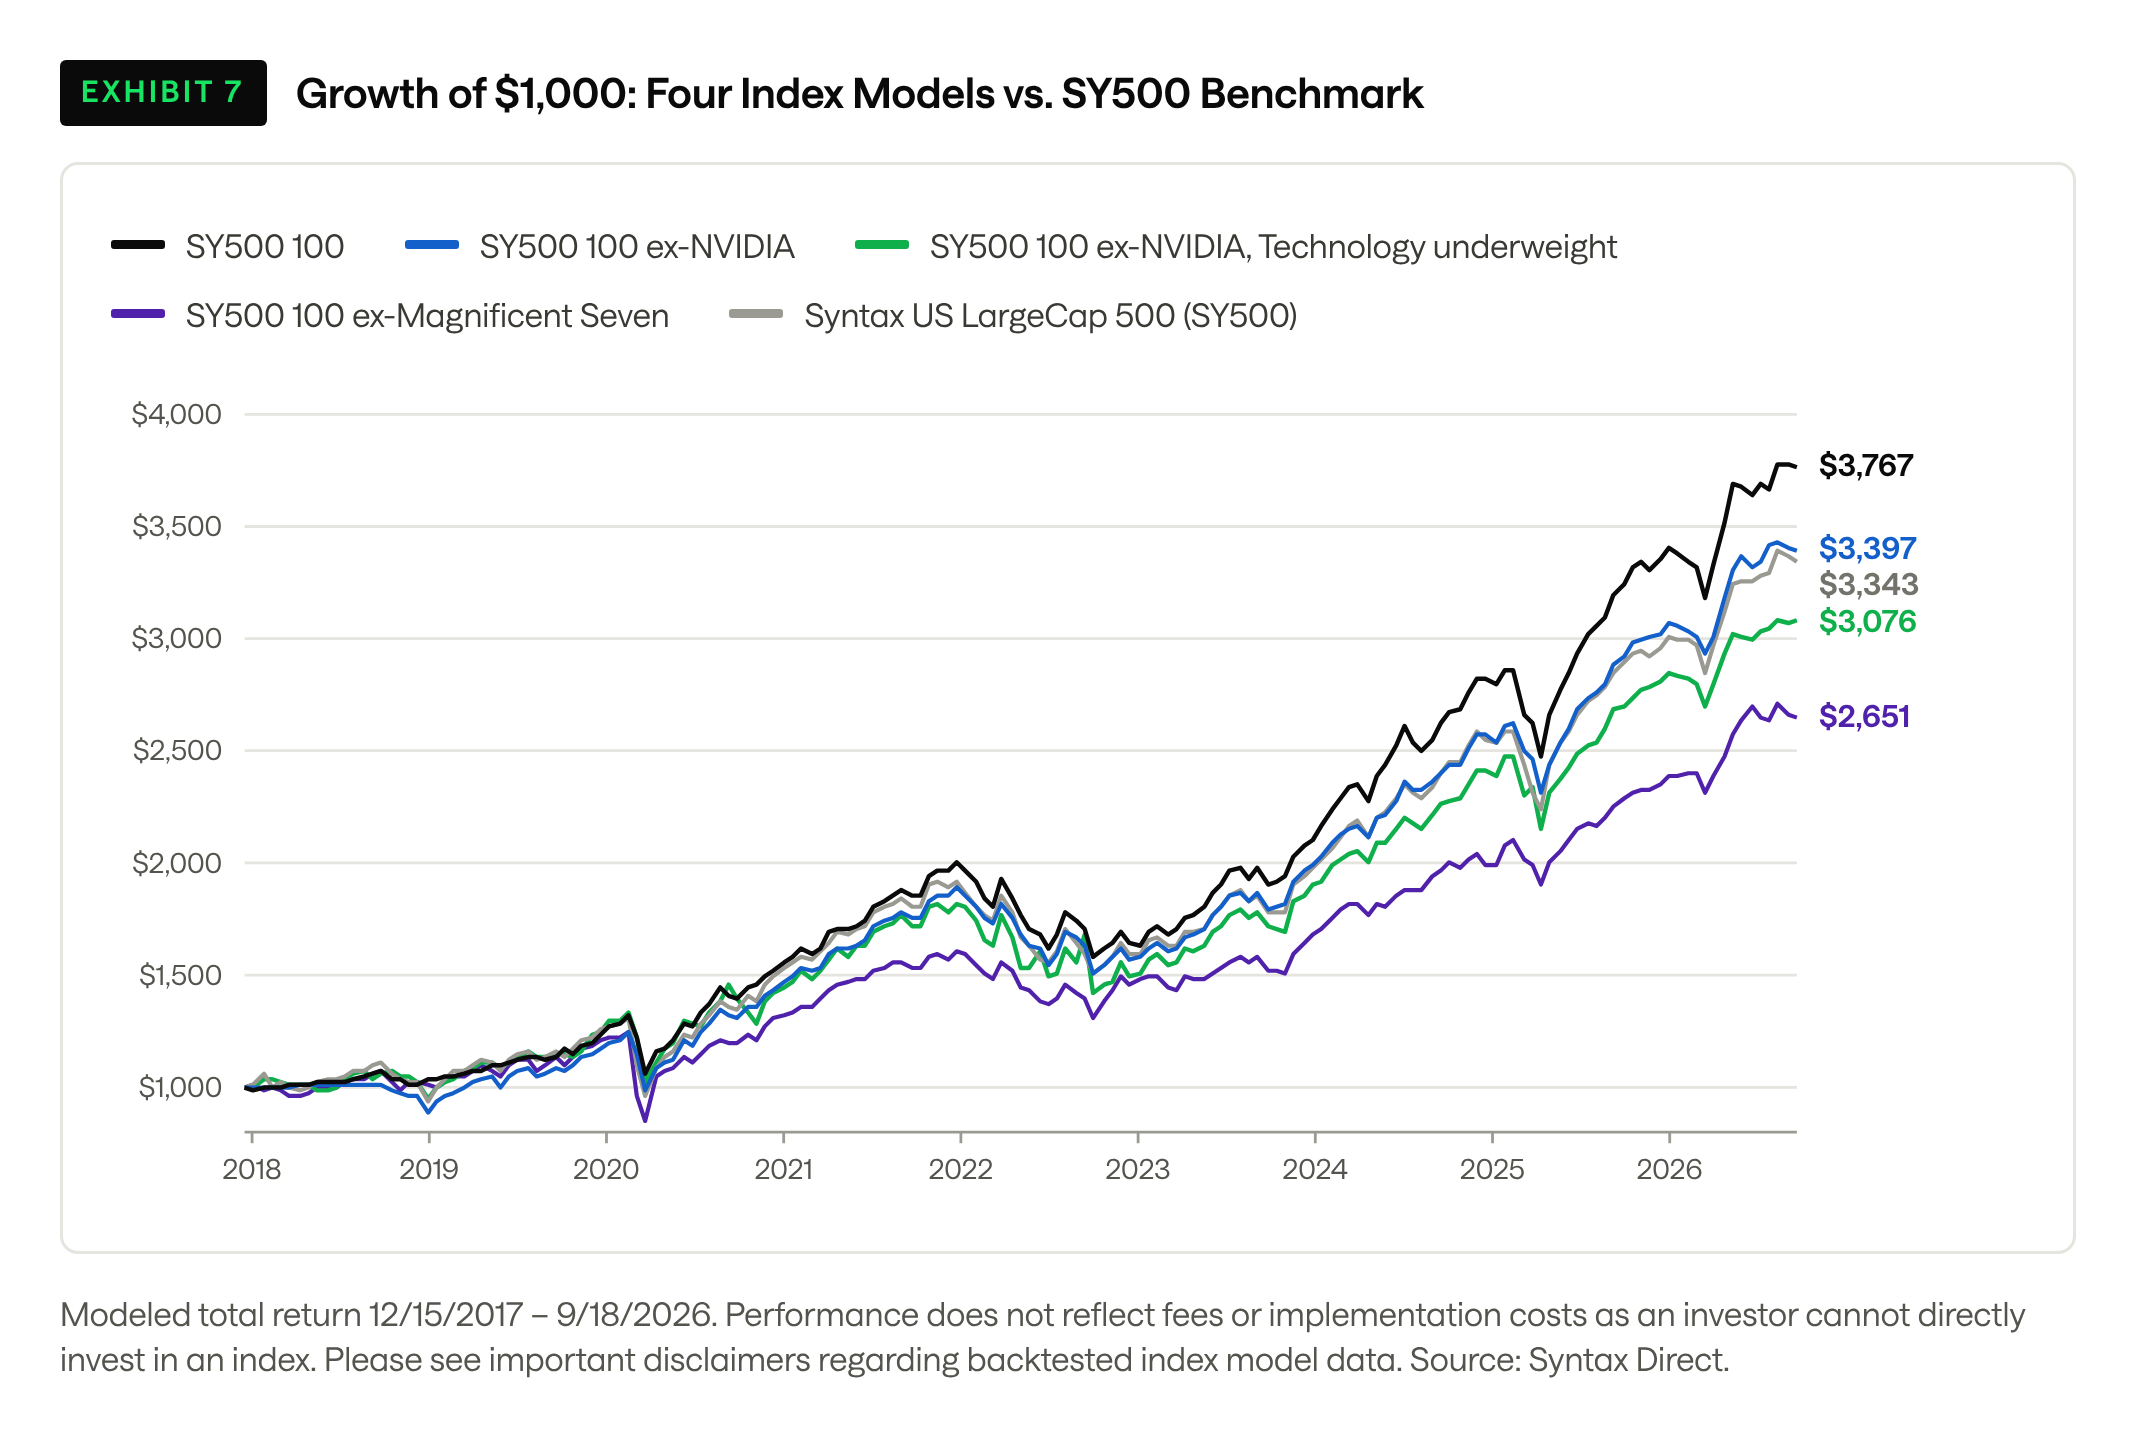
Over the full backtest from December 15, 2017 to September 18, 2026, the SY500 returned 14.78% annualized and the SY500 100 returned 16.35%, with tracking error of 2.53%, correlation of 0.99, and beta of 1.02. That excess return was earned almost entirely in three years. The SY500 100 beat the SY500 by 6.2 points in 2023, 4.1 in 2024, and 2.5 in 2025, a stretch in which NVIDIA's weight in the model rose from 2.5% to 9.7%, and it trailed by 1.7 points in 2022 and by 1.1 points in 2026 through September 18. A 100-stock capitalization-weighted index is a bet on the largest companies continuing to lead, and the 2023 to 2025 window shows what that bet pays when it works.
The ex-NVIDIA model returned 14.99% annualized over the full period, 21 basis points above the SY500 and 136 basis points below the SY500 100. A hypothetical $1,000 grew to $3,397 in the ex-NVIDIA model, $3,343 in the SY500, and $3,767 in the SY500 100. The cost of the exclusion was concentrated in 2024, when the model gave up 6.2 points to the SY500 100, and in 2023, when it gave up 3.6. Tracking error against the SY500 was 2.58%, essentially unchanged from the SY500 100, and beta fell from 1.02 to 0.99, because the overweight in one stock had been a large part of the baseline's active risk. The five-year Sharpe ratio reported by the platform fell from 0.63 to 0.53, against 0.55 for the SY500. Year to date in 2026 the model returned 10.98% against 12.90% for the SY500 and 11.78% for the SY500 100, so the exclusion cost return this year as well, and the 100-stock index lagged the 500 with or without it.
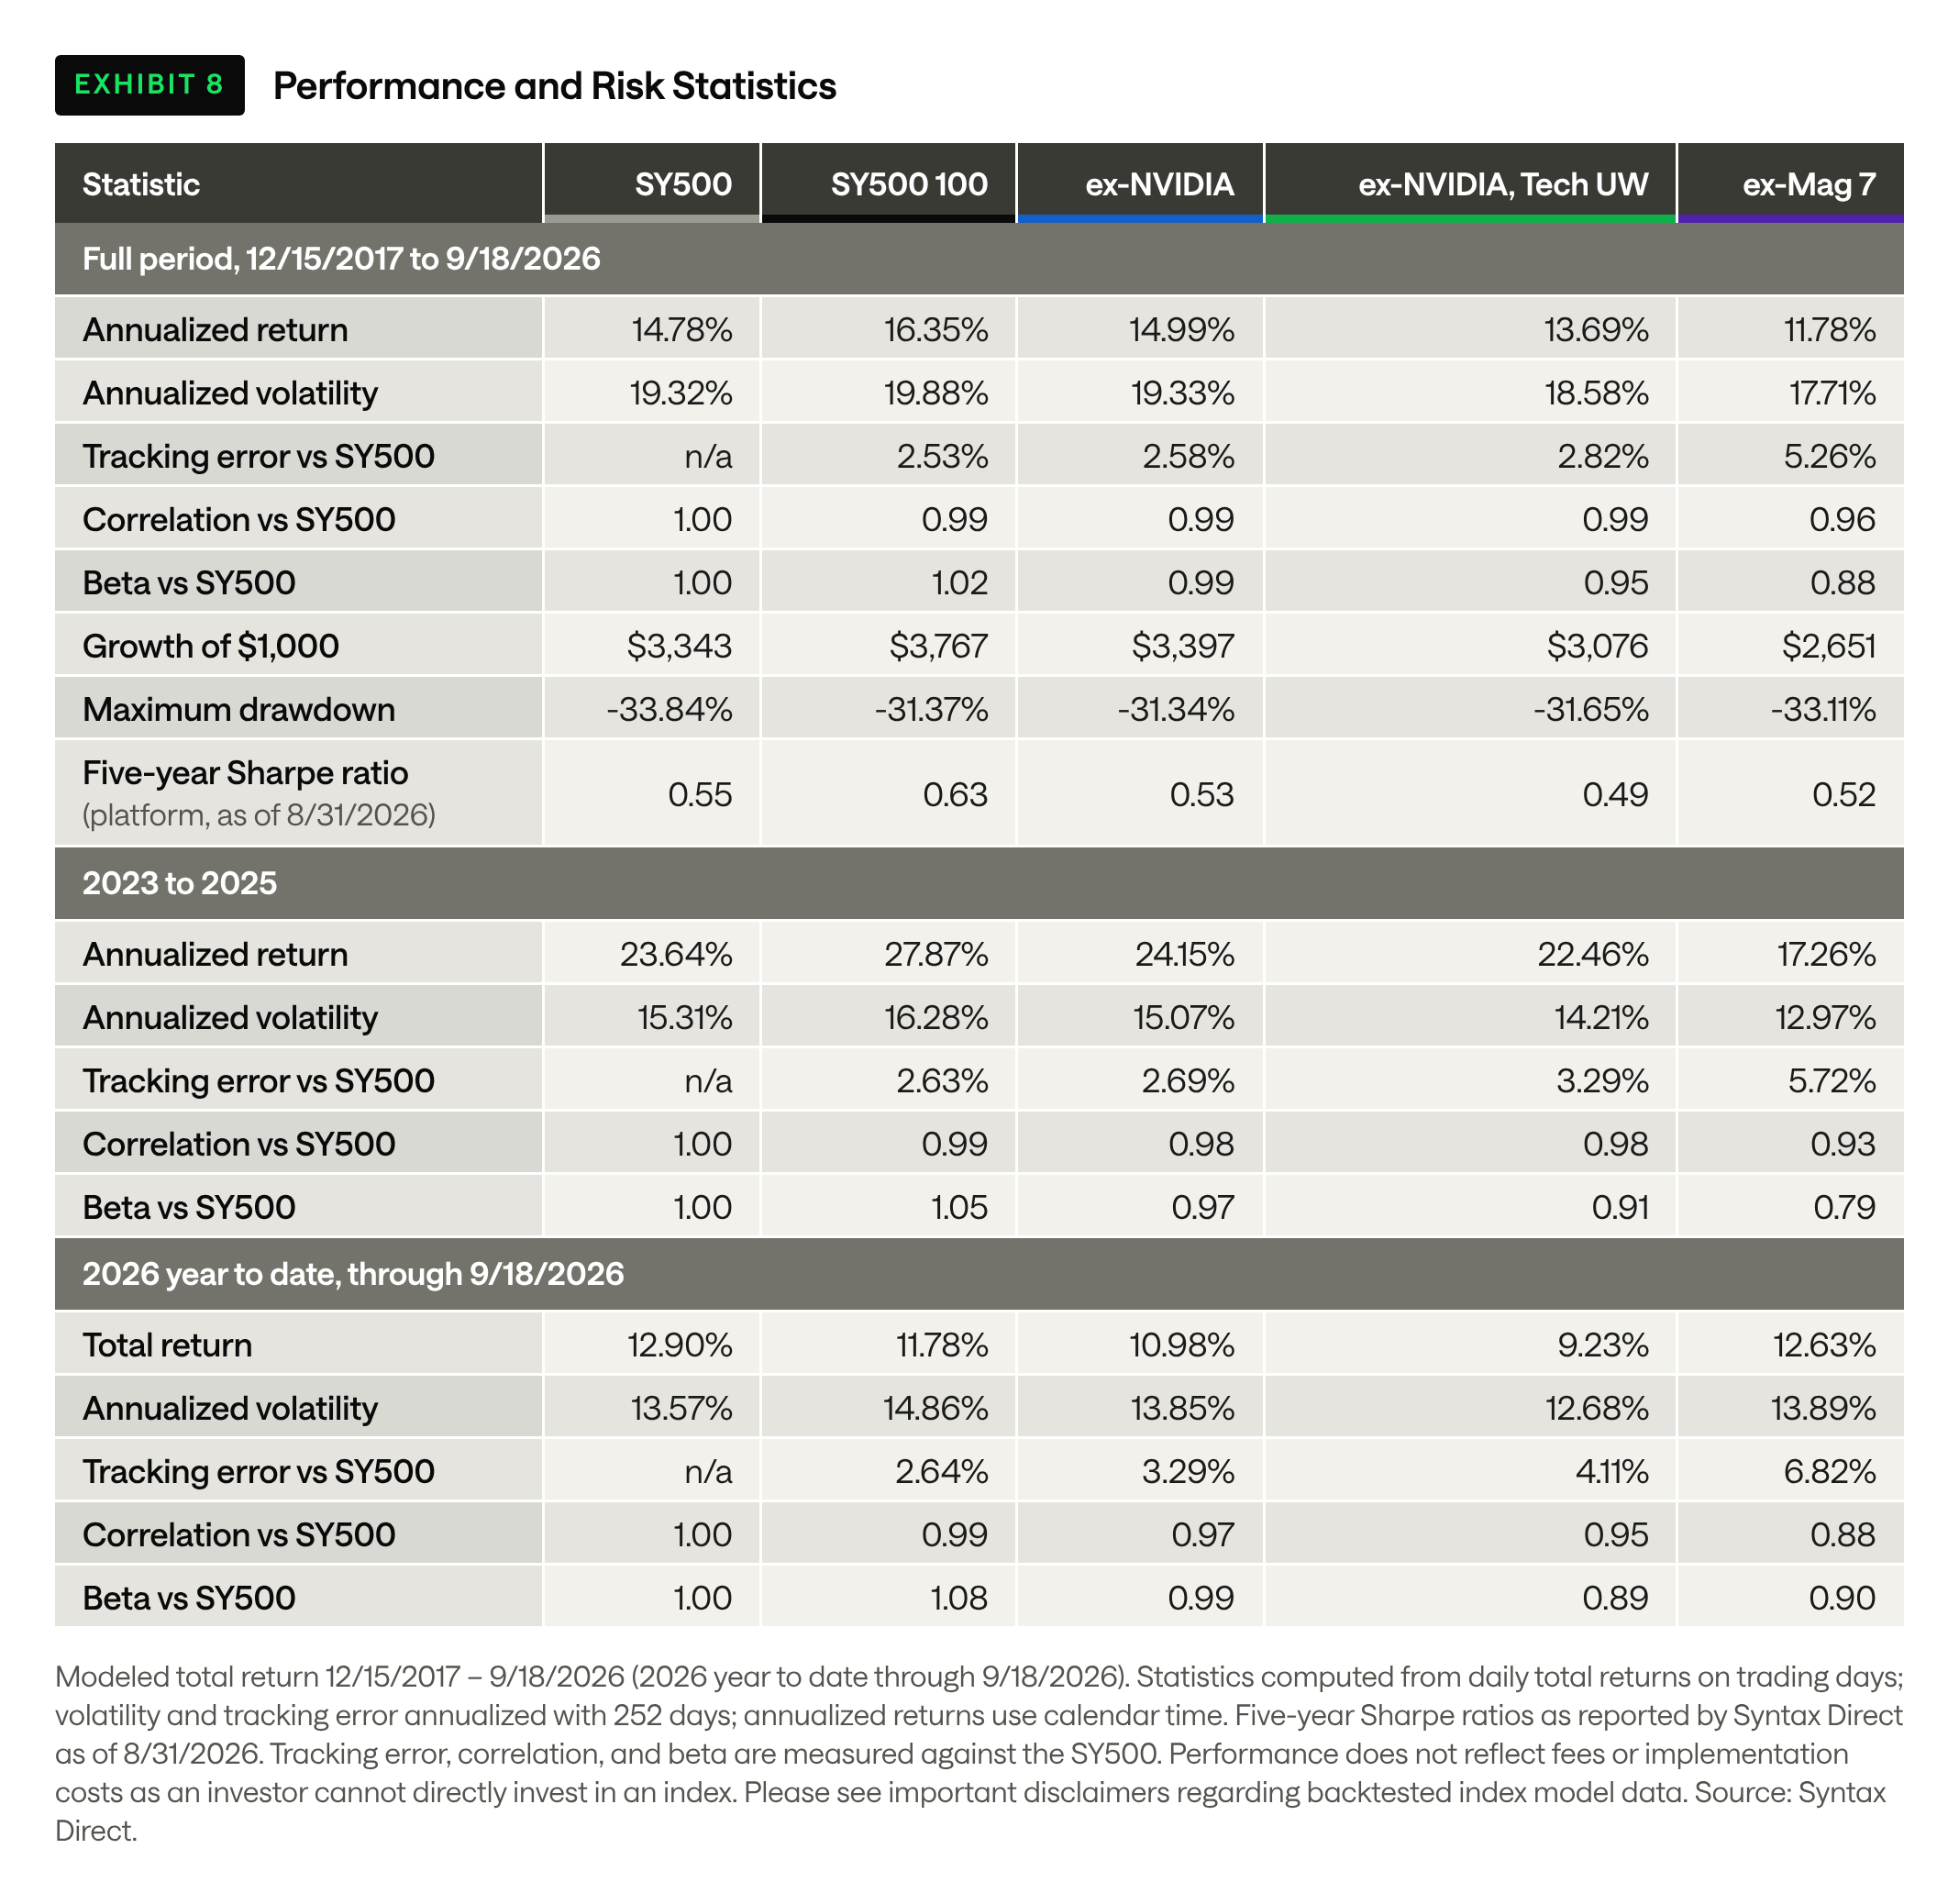
The Technology underweight model returned 13.69% annualized, 109 basis points below the SY500, and trailed it in seven of nine calendar years, with the largest gap of 3.7 points arriving in 2026 through September 18. Volatility fell to 18.58% against 19.32% for the SY500, beta to 0.95, and the maximum drawdown in the 2020 selloff was 31.65% against 33.84%.
Judged on its own, the sleeve underperformed because it was underweight the sector that led the market for most of the period. That is the wrong test for a completion sleeve. Its purpose is to make the client's total equity resemble the SY500 once the concentrated position is counted, and Exhibits 10 through 12 measure each model on that basis.
The ex-Magnificent Seven model is a different kind of portfolio. It returned 11.78% annualized over the full period, 300 basis points below the SY500, with tracking error of 5.26%, correlation of 0.96, and beta of 0.88. It trailed by 12.5 points in 2020, 12.1 in 2023, and 8.3 in 2024, and it led by 9.6 points in 2022 and 1.1 in 2025. In 2026 through September 18 it returned 12.63% against 12.90%, so the year in which returns broadened beyond the largest names did not produce a lead for the model that removed them. The breadth of 2026 came from companies below the top 100, which a 100-stock index cannot reach by exclusion. The 2020 drawdown was similar in depth at 33.11%, and the platform's recovery date of November 10, 2020 arrived 97 days after the benchmark's.
Completion Portfolio Exposure and Risk
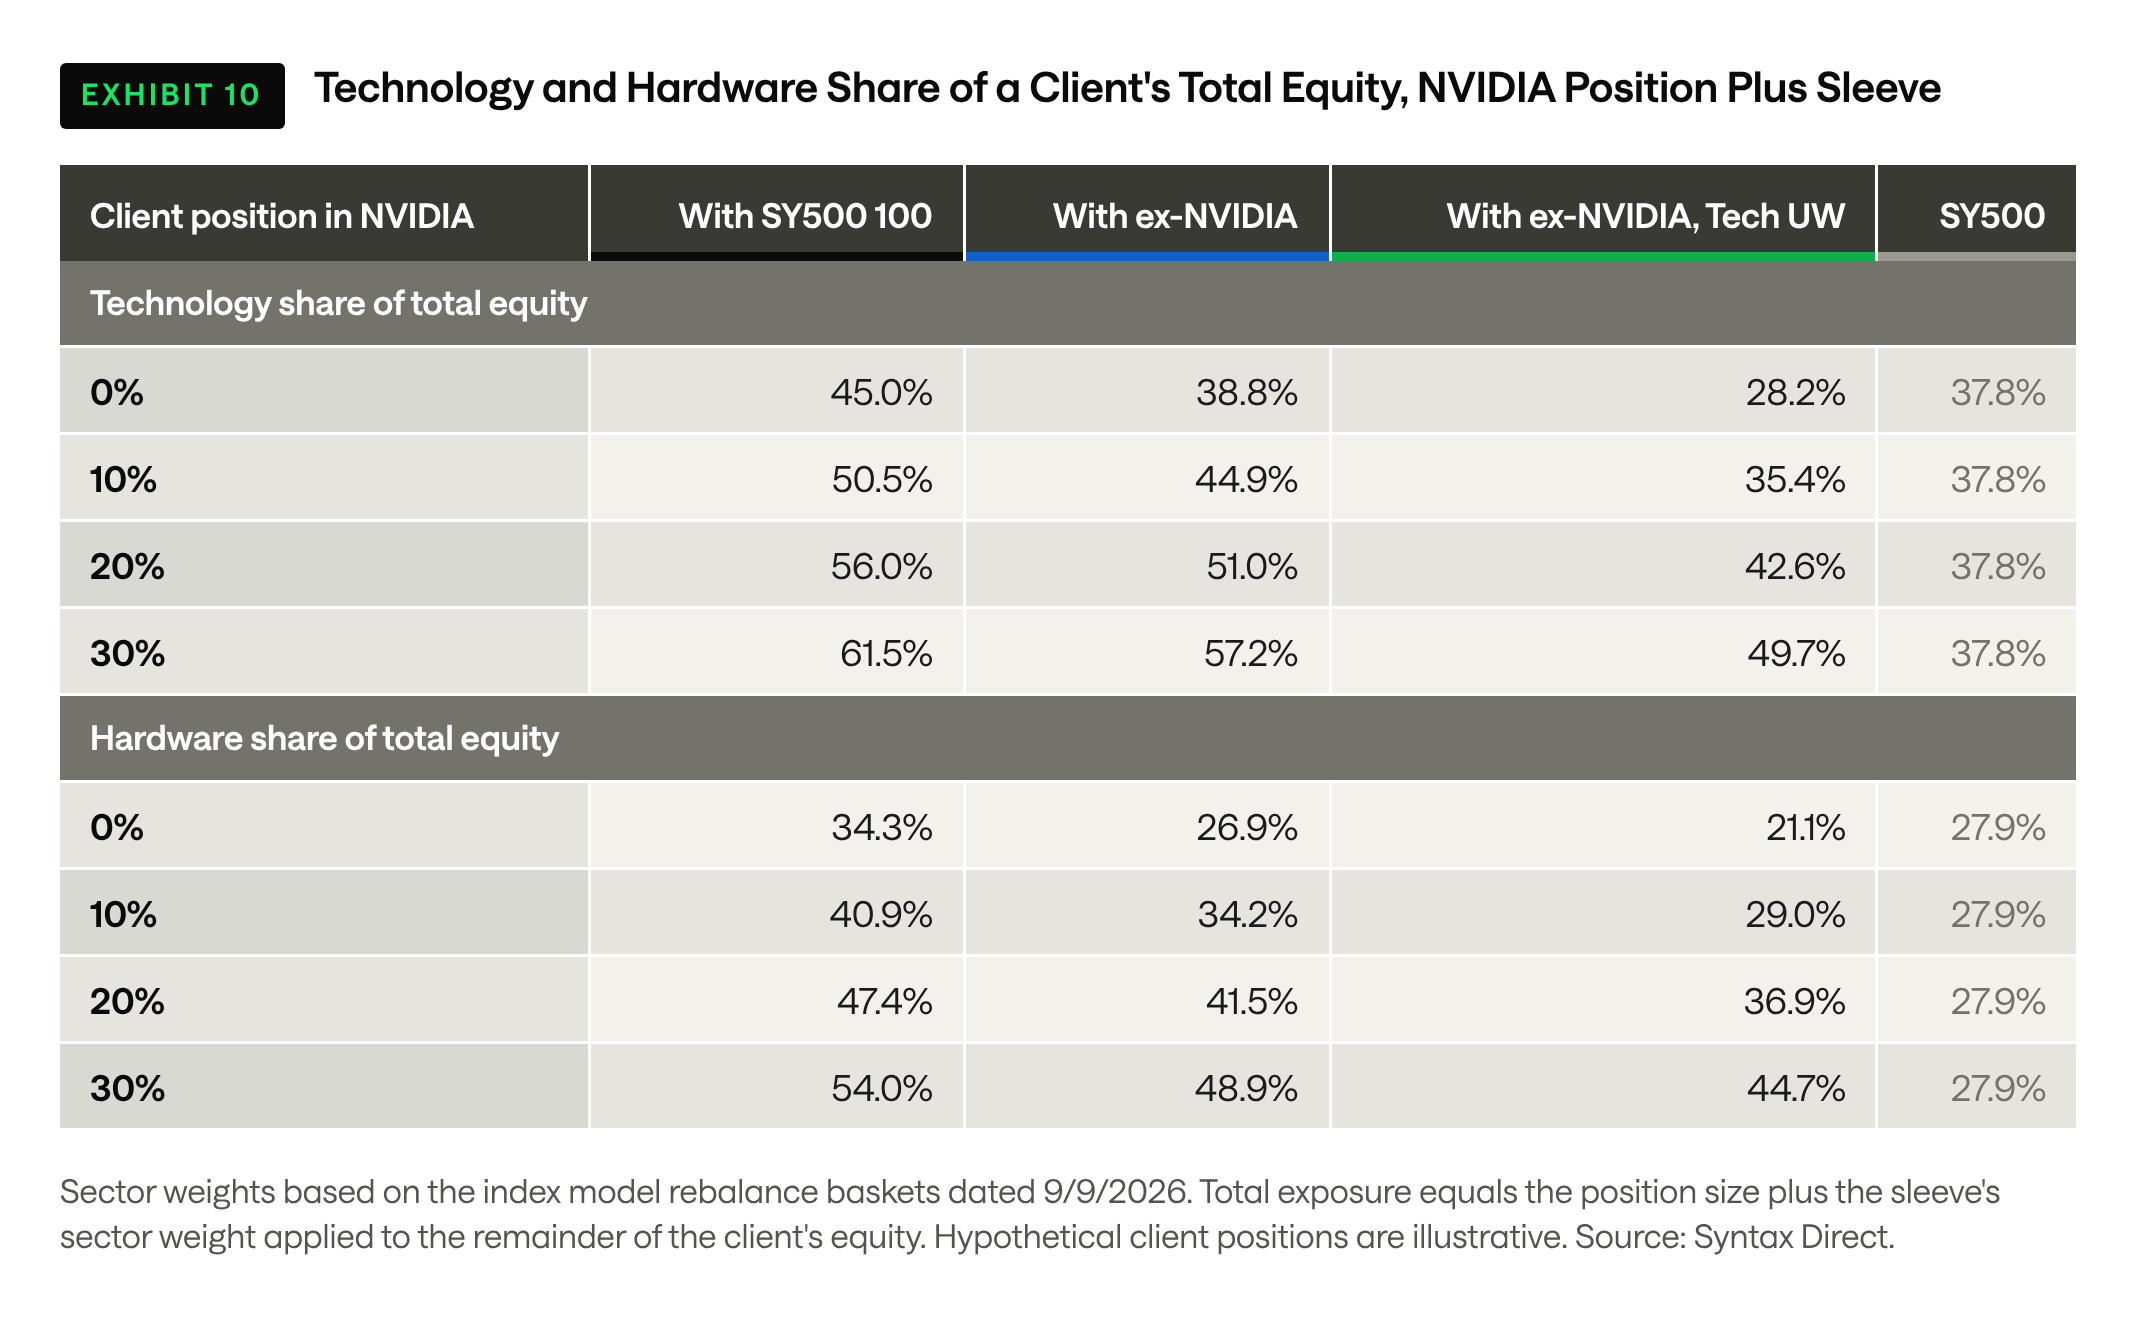
Exhibit 10 combines a hypothetical client position in NVIDIA with each sleeve and measures the Technology and Hardware share of the client's total equity against the SY500. A client with 20% of equity in NVIDIA and the remainder in the unmodified SY500 100 holds 56.0% in Technology and 47.4% in Hardware, against 37.8% and 27.9% for the SY500. The ex-NVIDIA sleeve brings those figures to 51.0% and 41.5%, and the Technology underweight sleeve to 42.6% and 36.9%. The low-conviction underweight fully offsets a position of about 13% of equity at the sector level and about 9% at the Hardware level. Larger positions call for the medium or high conviction settings, which sit on the same questionnaire step, or for a sub-sector underweight aimed directly at Hardware.
Exhibits 11 and 12 measure the same question with returns rather than weights. A hypothetical client holds a fixed share of equity in NVIDIA, the remainder in one of the three sleeves, and the total is compared with the SY500. The position is reset to its target at each quarterly index rebalance, which corresponds to a client who trims the stock on a schedule and has somewhere to put the proceeds. Without that discipline the position runs away from any sleeve. A 20% position in NVIDIA at the start of the backtest, left alone, would have been 76% of the client's equity by September 2026, because the stock returned 55% a year against 15% for the SY500. That gap also frames the return columns. Every portfolio that holds NVIDIA beat the SY500 by a wide margin over this period, and each step in sleeve design gave up about a point a year of total return at the 20% position, two points in all, because a completion sleeve forgoes part of the stock's own return in exchange for removing its duplicate.
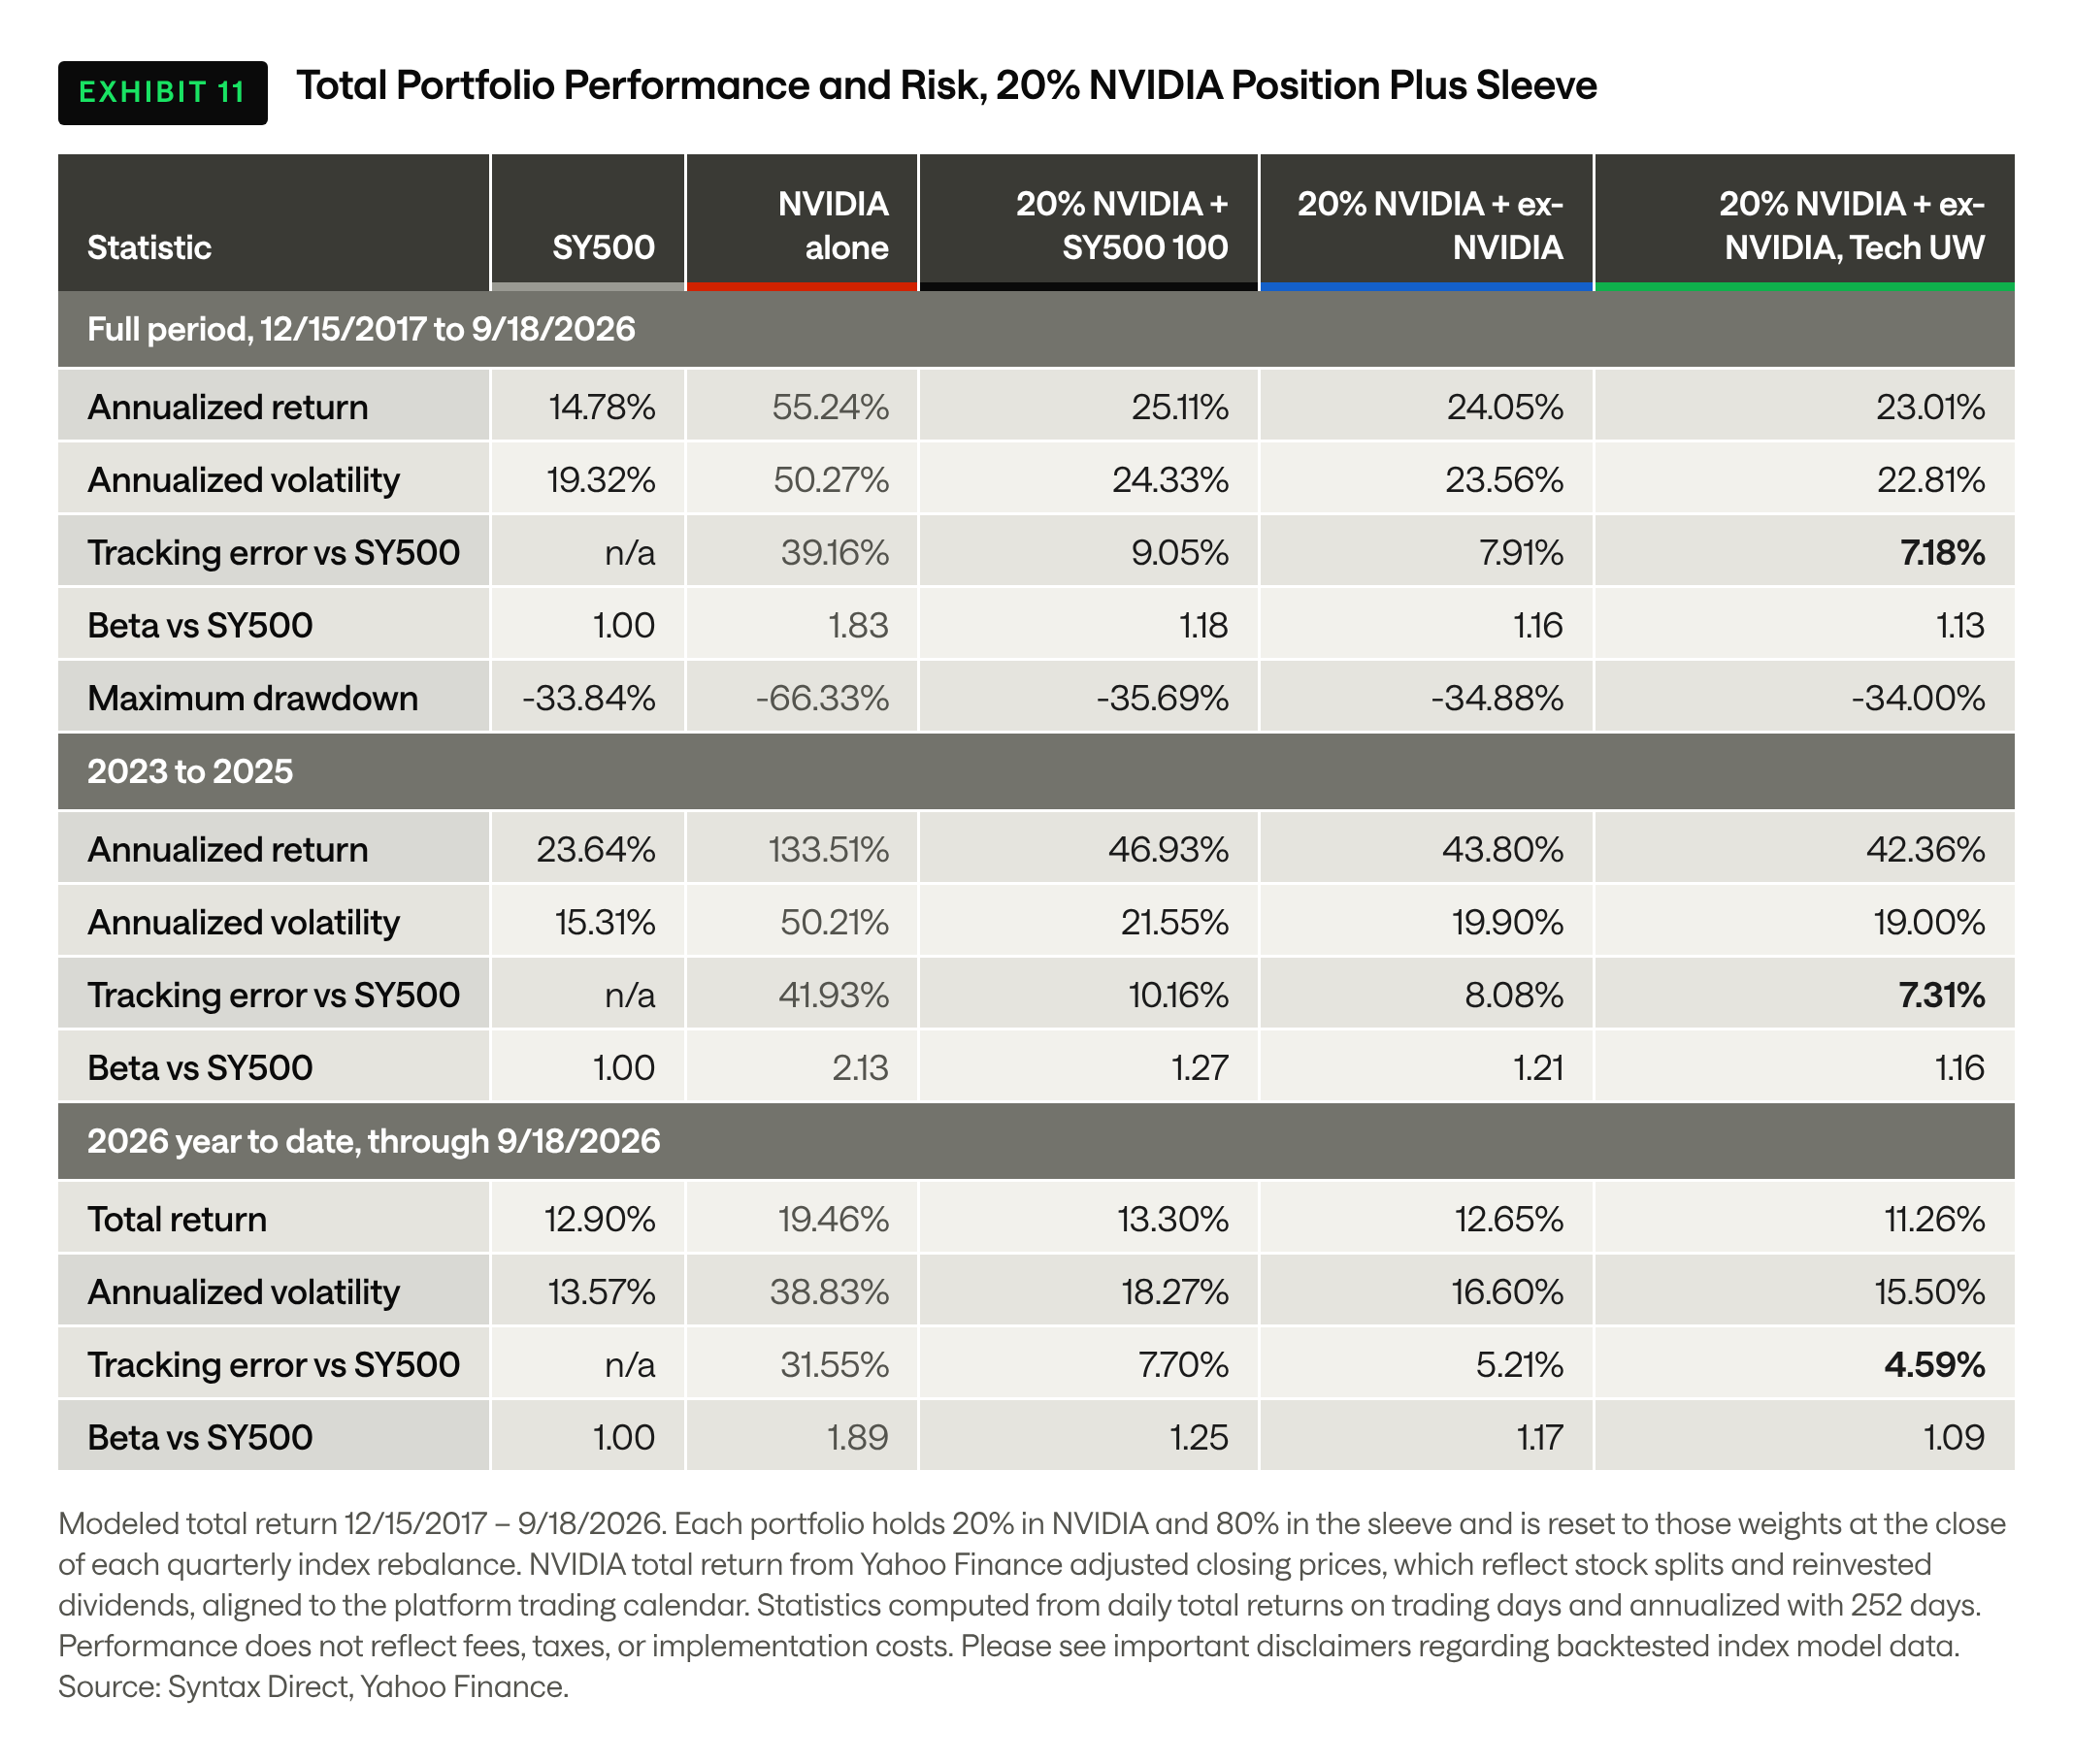
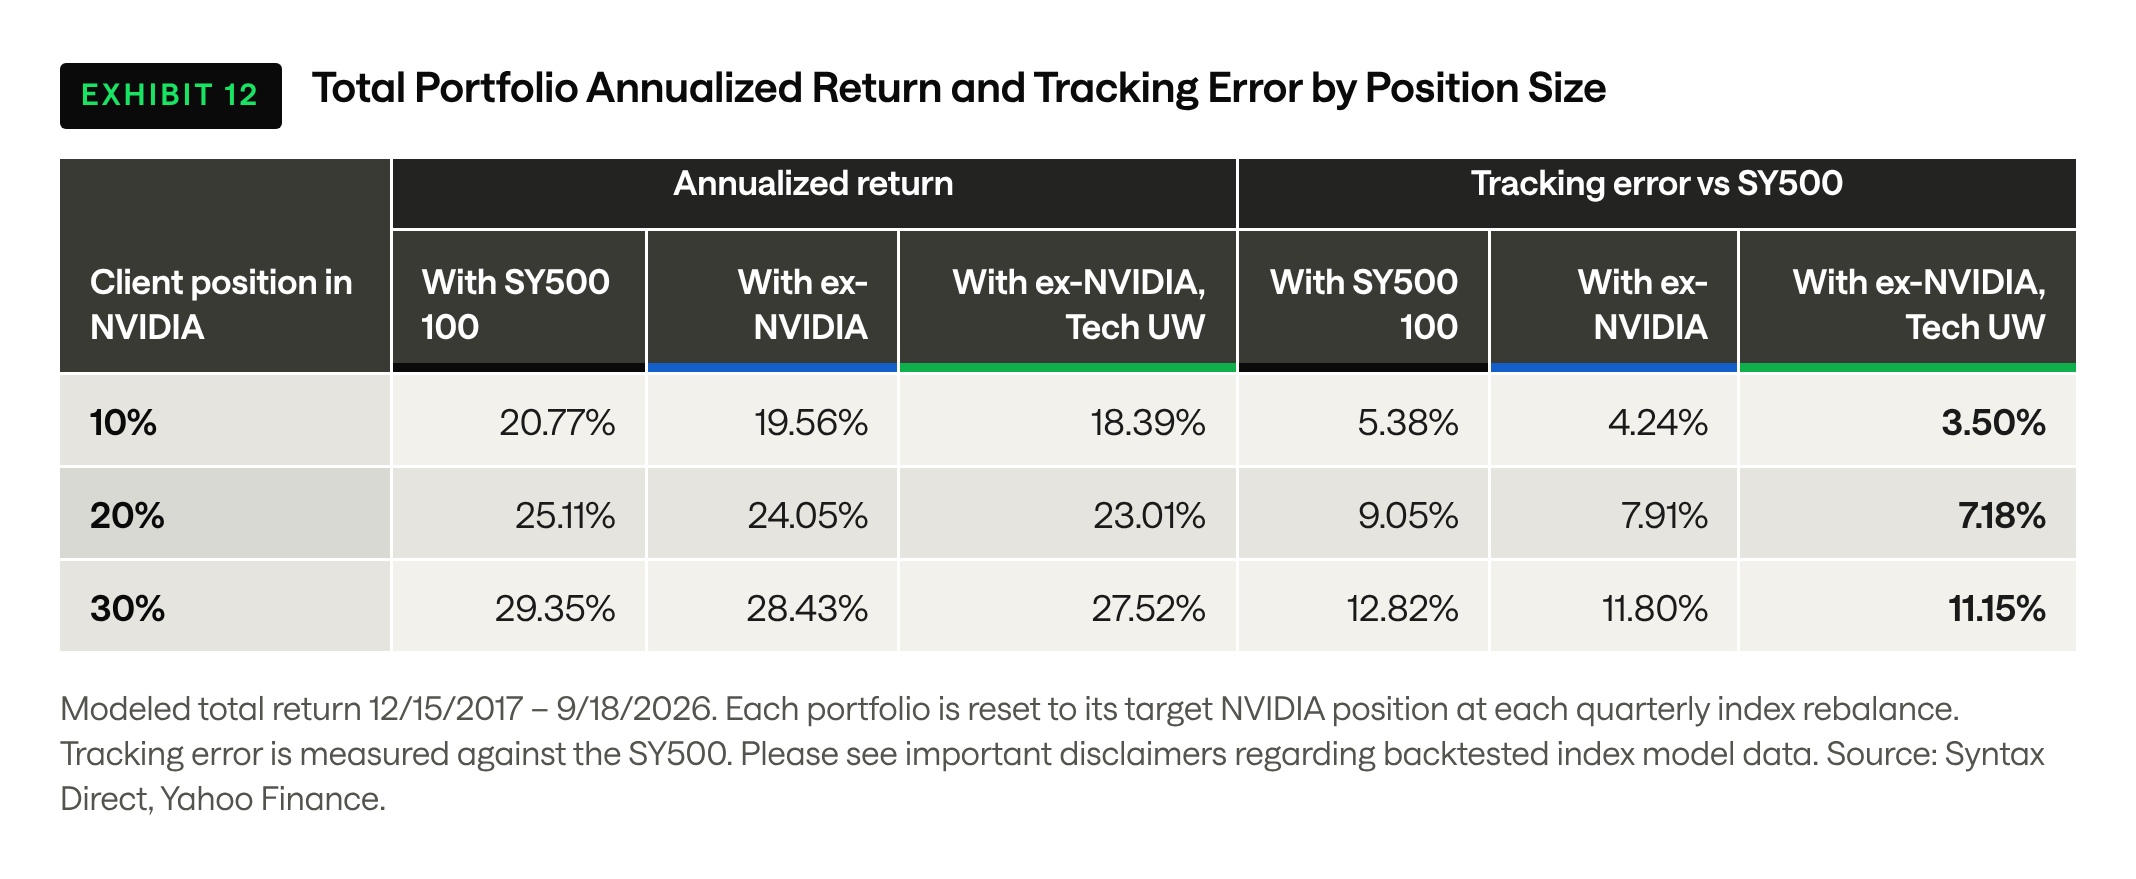
The risk columns are where the sleeve earns its place. With a 20% position, total-portfolio tracking error against the SY500 over the full period was 9.05% with the unmodified SY500 100, 7.91% with the ex-NVIDIA sleeve, and 7.18% with the Technology underweight sleeve, a reduction of about a fifth. Beta fell from 1.18 to 1.13, volatility from 24.3% to 22.8%, and the deepest drawdown, which for these portfolios arrived in October 2022 when NVIDIA had fallen 66% from its peak, eased from 35.7% to 34.0%. The effect is larger in the periods that matter most to a client who worries about the stock. In 2026 through September 18, tracking error fell from 7.70% to 4.59% across the three sleeves, and in 2023 through 2025 from 10.16% to 7.31%. Exhibit 12 shows that the proportional benefit is greatest for smaller positions. At 10%, the underweight sleeve cuts tracking error from 5.38% to 3.50%, roughly a third, while at 30% the reduction is from 12.82% to 11.15%, because the stock itself dominates the risk once it reaches that size and the conviction level, rather than the sleeve design, becomes the decision that matters.
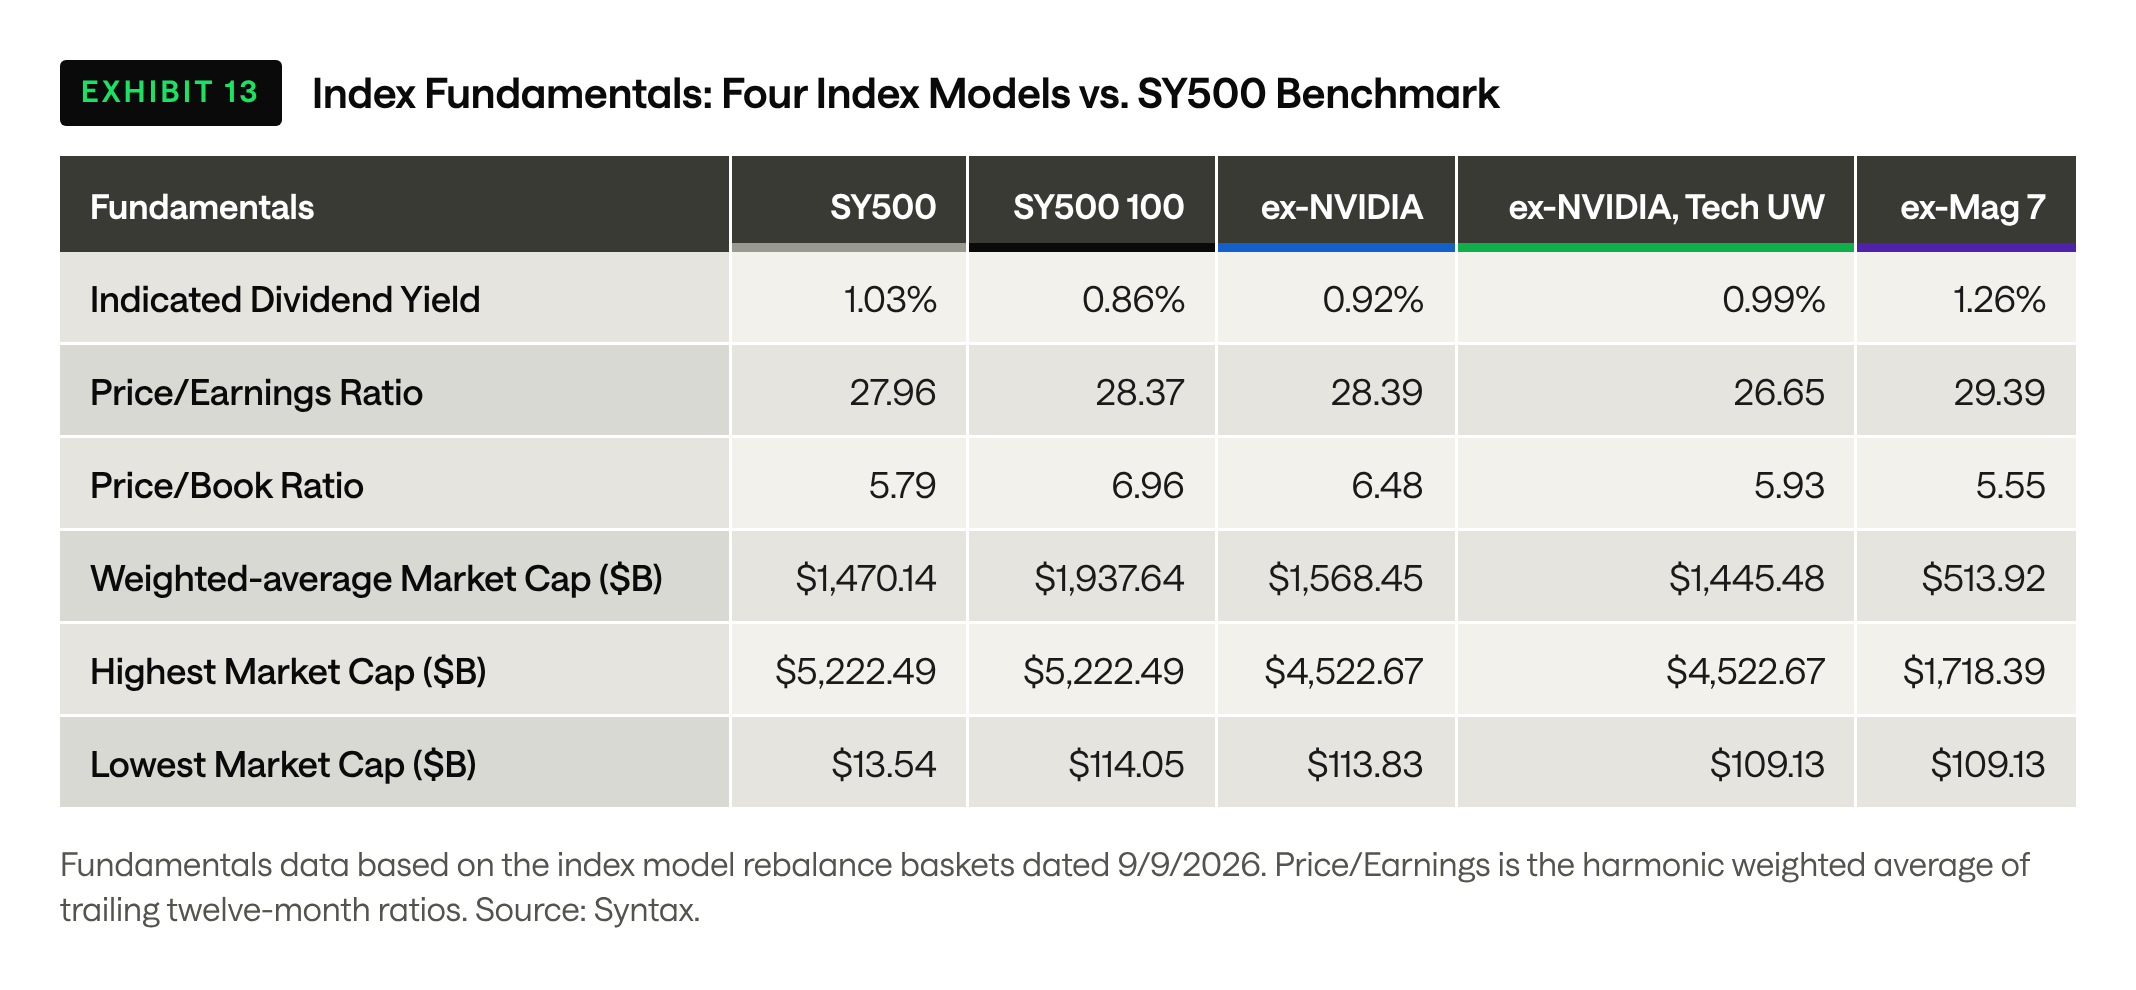
Index Fundamentals
Exhibit 13 compares key fundamental metrics for the four index models and the SY500 as of the most recent rebalance. The fundamentals move in the direction the construction implies. Indicated dividend yield rises from 0.86% in the SY500 100 to 0.92% without NVIDIA, 0.99% with the Technology underweight, and 1.26% without the Magnificent Seven, against 1.03% for the SY500. Price-to-book falls along the same path from 6.96 to 5.55, against 5.79. Price-to-earnings is 28.4 in the first two models, 26.7 in the underweight model, and 29.4 in the ex-Magnificent Seven model, above the SY500's 28.0, because the semiconductor and pharmaceutical names that absorb the excluded weight trade at high multiples of their own. Weighted-average market capitalization falls from $1.94 trillion in the SY500 100 to $1.57 trillion, $1.45 trillion, and $514 billion, against $1.47 trillion for the SY500, so the underweight model is the first of the three completion sleeves that is no longer tilted toward the largest companies.
Putting It Into Practice
This case study illustrates how an advisor can use Syntax Direct to build a large-cap benchmark around a concentrated stock position, one decision at a time, and to see the cost and effect of each decision before deploying it. Excluding the name removes the direct overlap and, in the period studied, gave back the baseline's excess return over the SY500 without adding tracking error. Underweighting the sector offsets the exposure the client holds outside the sleeve, at a return cost the advisor can size in advance by choosing the conviction level, and for a client with a fifth of equity in one stock the two steps together reduced total-portfolio tracking error by about a fifth over the full period and by 40% in 2026. The platform performs the exclusion, backfill, redistribution, capping, sector scaling, and quarterly rebalancing from the questionnaire selections, and every index created on the platform comes with an automatically generated factsheet and a compliance-ready index rulebook that documents the assumptions used in its construction.
Two conclusions carry beyond the NVIDIA example. The first is that owning a 100-stock capitalization-weighted benchmark is a concentration decision on its own, and its outperformance from 2023 through 2025 was the return on that decision rather than on any customization. The second is that exclusion alone does not de-concentrate a benchmark, because the excluded weight is redistributed to remaining names. A sleeve that removed the Magnificent Seven still held a third of its weight in ten companies and carried more than 5% tracking error against the SY500. Advisors who want breadth as well as a smaller top position have other levers on the platform, including a larger holding count, the modified equal weighting option, and sector or sub-sector caps, and those are the natural subjects of a follow-up study.
Build it in Syntax Direct
To learn more about Syntax Direct or to schedule a demo
Visit www.syntaxdata.com or contact sgrieco@syntaxdata.com
Disclaimers
Past performance is no guarantee of future results. The SY500 100 Index Model, the SY500 100 ex-NVIDIA Index Model, the SY500 100 ex-NVIDIA Technology Underweight Index Model, and the SY500 100 ex-Magnificent Seven Index Model (the “Index Models”) are hypothetical index models built on the Syntax US LargeCap 500 Index (SY500). All performance, holdings, and fundamentals information provided on the Index Models is backtested. All performance presented for the Syntax US LargeCap 500 Index prior to its inception is backtested. Backtested performance is not actual performance but is hypothetical and is suitable only for institutional audiences. Backtested performance may not be predictive of actual or future performance. Backtested data may reflect the application of the index methodology with the benefit of hindsight, and the historic calculations of an index may change from month-to-month based on revisions to the underlying economic and/or financial data used in the calculation of the index. Charts and graphs are provided for illustrative purposes only. The hypothetical client positions shown in Exhibits 10 through 12 are illustrative and do not represent any actual investor; NVIDIA total return data used in those exhibits are from Yahoo Finance and have not been independently verified by Syntax. Syntax® is a registered trademark of Syntax, LLC and/or its affiliates. Index and index model performance does not represent actual fund or portfolio performance, and such performance does not reflect the actual investment experience of any investor. An investor cannot invest directly in an index or index model. In addition, the results actual investors might have achieved would have differed from those shown because of differences in the timing, amounts of their investments, and fees and expenses associated with an investment in a portfolio invested in accordance with an index or index model. Neither the Index Models nor the benchmark indices portrayed herein charge management fees directly to end investors or incur brokerage expenses, and no such fees or expenses were deducted from the performance shown; provided, however, that the returns of any investment portfolio invested in accordance with such indices would be net of such fees and expenses. Additionally, none of these indices lend securities, and no revenues from securities lending were added to the performance shown. Performance shown is unaudited and subject to revision. The Syntax US LargeCap 500 Index is the property of Syntax, LLC, which calculates and maintains the index. Weighted Average Stock Price-to-Earnings Ratio (P/E Ratio) is the harmonic weighted average of the ratio of each stock’s share price to its trailing 12-month earnings per share. Indicated Dividend Yield is the arithmetic weighted average of the ratio of each stock’s annual dividend per share to its market price. Price-to-Earnings and Dividend Yield are calculated as of the labeled period-end. P/E and Dividend Yield are calculated by Syntax using data from Refinitiv. Top holdings and security classifications used in calculating allocation tables are based on ending weight as of the labeled period end. This report is for informational purposes only and is not intended to be, nor should it be construed or used as an offer to sell, or a solicitation of any offer to buy, any security or investment vehicle, nor should it be redistributed. Additionally, the information herein is not intended to provide, and should not be relied upon for, legal advice, tax advice, financial advice, or investment advice. You should make an independent investigation of the matters described herein, including consulting your own advisors on the matters discussed herein. In addition, certain information contained in this case study has been obtained from published and non-published sources prepared by other parties, which in certain cases have not been updated through the date hereof. While such information is believed to be reliable for the purpose used in this case study, such information has not been independently verified by Syntax and Syntax does not assume any responsibility for the accuracy or completeness of such information. Syntax LLC, its affiliates and their independent providers are not liable for any informational or technical errors, incompleteness, or delays, or for any actions taken in reliance on information contained herein. Distribution of Syntax data and the use of Syntax indices, data, software, or technology to create financial products require a license with Syntax and/or its licensors. Investments are not FDIC insured, may lose value and have no bank guarantee.